
More injected fluid doesn’t necessarily mean more oil is being contacted. A waterflood may produce increasing volumes of water while injected fluid channels through high-permeability layers, leaving oil-bearing zones bypassed. That’s the central challenge of oil reservoir sweep efficiency improvement: increasing contact with recoverable oil, rather than simply increasing injection.
If production is uneven or water cut is rising, it’s reasonable to question whether the displacement process is reaching the reservoir effectively. But those signals alone don’t reveal the cause. Heterogeneity, mobility differences and uneven coverage can all contribute, and each calls for a different response.
This article explains how sweep efficiency relates to displacement and recovery, and how to assess evidence of channelling, bypassed oil and poor conformance. It also compares improvement strategies by reservoir fit, operating constraints and measurable response, so decisions are grounded in diagnostic evidence rather than technical promise alone. The aim is a practical framework for evaluating opportunities to optimize existing conventional assets.
Key Takeaways
- Separate areal and vertical sweep from displacement efficiency to assess what the reservoir is, and isn’t, recovering.
- Trace how permeability contrasts, fractures, connectivity and fluid mobility can direct injected fluids away from oil-bearing zones.
- Build a reliable diagnosis by validating production and injection data, locating uneven flow, and recording a baseline before intervention.
- Compare oil reservoir sweep efficiency improvement options by matching each approach to the diagnosed flow problem and operating constraints.
- Set production, injection, pressure and water-cut measures before implementation so results can guide monitoring and reassessment.
What oil reservoir sweep efficiency measures, and why it matters
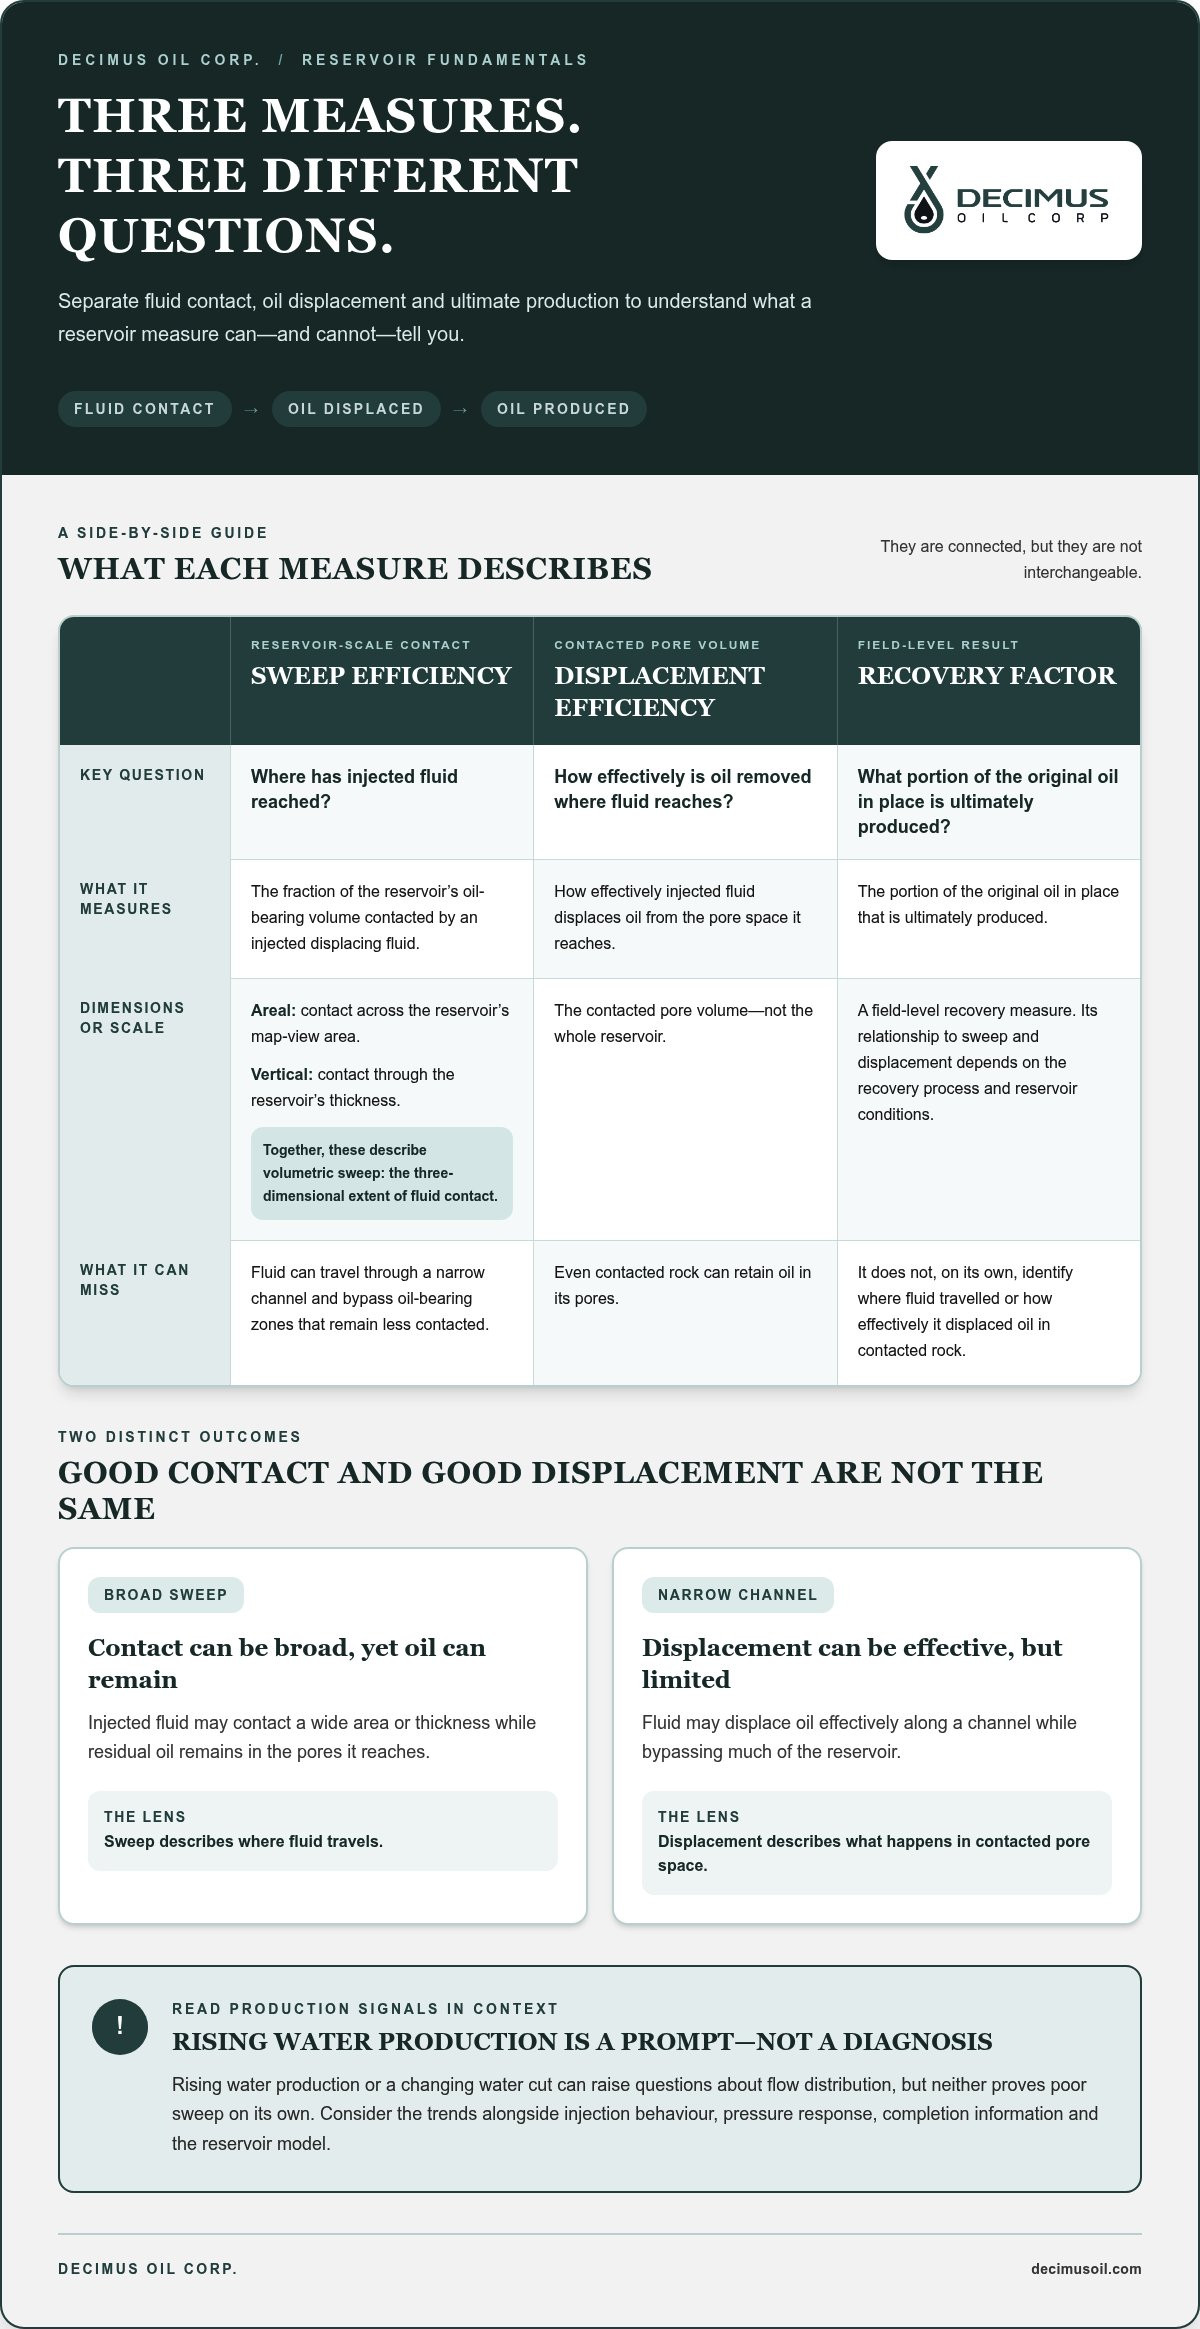
Sweep efficiency is the fraction of a reservoir’s oil-bearing volume contacted by an injected displacing fluid. It describes where the fluid travels, not how effectively it removes oil from the rock it reaches. That distinction matters: injection can continue while portions of the reservoir remain untouched.
Sweep efficiency versus displacement efficiency
Sweep has horizontal and vertical dimensions. Areal sweep describes how much of the reservoir’s map-view area the injected fluid contacts. Vertical sweep describes how much of its thickness is contacted. Together, these dimensions indicate volumetric sweep, the three-dimensional extent of fluid contact.
Conceptual cross-section:
- Areal view: Injector → swept zone → unswept oil beyond the advancing front
- Vertical view: Injected fluid moves through a permeable layer, while oil remains in less-contacted layers above or below
Even in contacted rock, some oil may remain in the pores. Displacement efficiency describes how effectively the injected fluid displaces oil from the pore space it reaches. Sweep concerns reservoir-scale contact; displacement concerns what happens within that contacted pore volume. A fluid can achieve broad sweep but leave residual oil behind, or displace oil effectively in a narrow channel while bypassing much of the reservoir.
Recovery factor is a further, field-level measure: the portion of the original oil in place ultimately produced. Sweep and displacement influence recovery, but they are not interchangeable with it. Their relationship depends on the recovery process and reservoir conditions. Enhanced oil recovery (EOR) techniques often focus on improving sweep efficiency.
Why sweep becomes a production and asset question
Fluid distribution shapes production response and determines where remaining oil may be located. If injected water or gas follows a preferential path, producers connected to that path may respond while other oil-bearing zones receive less effective displacement. The result can be uneven well performance and oil left in parts of the reservoir that injection has not adequately contacted.
Rising water production or a changing water cut can prompt questions about flow distribution, but neither proves poor sweep on its own. Production trends may have several explanations, so consider them alongside injection behaviour, pressure response, completion information and the reservoir model. The next section examines how geological variation and injection conditions can create uneven flow.
Oil reservoir sweep efficiency improvement is therefore an asset-specific opportunity, not a guaranteed production uplift. Begin by establishing where injected fluids are going, where oil may remain, and whether changing flow distribution could support better recovery. That distinction keeps technical screening connected to operational efficiency and disciplined resource development.
How reservoir geology and injection conditions create uneven sweep
Injected fluid follows the paths available to it, which are shaped by both the reservoir and well operations. Reservoir heterogeneity, including contrasts in permeability, layering, fractures and connectivity, can direct fluid through some zones more readily than others. Less-connected oil-bearing rock may receive limited contact. This is a conceptual flow mechanism, not proof that a particular field has a channeling problem.
Geological controls on fluid movement
Porosity is the space within rock that can hold fluids; permeability describes how readily those fluids can move through connected spaces. Connectivity refers to how well pore networks, layers or fractures link across the reservoir. These properties vary, so a reservoir is rarely a uniform block.
For example, a high-permeability streak or conductive fracture may provide a comparatively easy route between an injector and a producer. Injected water can move quickly along it while adjacent, lower-permeability layers remain less contacted. Layer boundaries and discontinuous connections can further limit crossflow between zones. Geology may suggest this pattern, but confirming it requires field evidence such as injection profiles, pressure behaviour and production response.
Injection and fluid controls on sweep
Fluid properties also influence the advancing front. The mobility ratio compares the ease with which the displacing fluid moves through the rock against that of the oil it is displacing. A more mobile injected phase can be prone to unstable advance, including fingers that move ahead through easier pathways. Viscosity and relative permeability both matter, so no single mobility-ratio cutoff applies to every reservoir.
Operating conditions can reinforce or moderate these tendencies. Injection rate and pressure affect how fluid enters available pathways, while pressure constraints may limit the rate or distribution that can be achieved. Completion configuration matters too: if one interval takes a disproportionate share of injected fluid, other intervals may receive less. Consider adjustments in the context of injectivity, well design and the reservoir’s layered structure, rather than treating them as stand-alone fixes.
Reservoir simulation can test competing explanations by representing geological variation, fluid behaviour and operating conditions. Surveillance data can then help assess whether the model reflects observed pressure and production trends. Neither replaces diagnosis: consider model assumptions and field measurements together. This evidence-led approach is central to oil reservoir sweep efficiency improvement because the right response depends on the flow problem actually present.
For asset owners evaluating existing conventional resources, linking geological understanding with operating evidence supports disciplined development decisions. Decimus Oil Corp.’s resource development perspective includes conventional exploration, resource development and enhanced oil recovery.
How to diagnose poor sweep before comparing improvement methods
A rising water cut or uneven well response can signal a change in fluid distribution, but neither proves that injected fluid is bypassing oil. A defensible diagnosis brings production, injection, pressure, completion and geological evidence together, then tests whether the observed pattern is consistent with a sweep problem. This sequence keeps oil reservoir sweep efficiency improvement focused on a supported cause rather than an early assumption.
What production and surveillance data can reveal
Review injection and production trends by well over relevant operating periods, not as isolated readings. Compare water-cut changes with pressure behaviour, injection rates, completion intervals, well interventions and operating changes. A production shift that follows a rate adjustment, for example, needs to be interpreted in that operating context. Missing measurements, inconsistent data and changing well conditions can all limit what a trend tells you.
Use the evidence in combination. Injection data can show how fluid is distributed at the well or pattern level; production and water-cut trends show how producers respond; pressure data adds context about communication and flow. Completion and geological information help relate those responses to reservoir intervals and possible pathways. No single diagnostic indicator proves poor sweep.
How to test a suspected flow-distribution problem
Use a structured workflow to move from signal to decision:
- Define the signal: State what changed, where, and over what operating period.
- Validate the data: Check measurement consistency, gaps, well status and operational changes.
- Locate uneven flow: Compare well-level injection, production, water-cut and pressure patterns with completion and geological information.
- Test competing causes: Assess whether connectivity, layering, operating conditions or another explanation best fits the evidence.
- Set a baseline: Record pre-intervention production, injection, pressure and water-cut indicators under documented operating conditions.
Where appropriate, tracer testing can help investigate communication between injection and production locations. Interwell response, including the timing and pattern of changes in nearby producers, can provide further evidence about connectivity. Interpret it alongside operating history and other data. These tools test specific flow-distribution hypotheses; they don’t independently establish the full location or volume of bypassed oil.
Reservoir simulation and history matching provide another test. Engineers can compare alternative geological and flow interpretations against observed production, injection and pressure behaviour. A model that reproduces the history supports an interpretation, but it doesn’t remove uncertainty in the assumptions or replace field surveillance.
Before selecting an intervention, document the suspected flow problem, supporting evidence, remaining uncertainties and baseline measures. This creates a reference for assessing whether a later response aligns with the original diagnosis, rather than relying on a single production change as proof of success.
How to compare reservoir sweep efficiency improvement options
Once diagnostics identify a likely flow problem, compare interventions by the mechanism they target, the strength of the evidence and the conditions required to implement them. A measure that redirects fluid between intervals won’t necessarily address a mobility problem, while adding a well won’t correct poor injection distribution by itself. Enhanced oil recovery options differ in mechanism and operating demands; see this overview of enhanced oil recovery techniques for broader context.
Conformance and injection-profile adjustments
Conformance control aims to alter fluid distribution, such as reducing flow through a dominant interval so other zones can receive more injection. Injection-rate or profile adjustments may also help address uneven allocation, but their suitability depends on injectivity, pressure limits, well completions and facility capacity. The flow problem is the diagnosis; the intervention is a proposed way to address it. Field response must show whether the two align.
Mobility control and other reservoir-specific approaches
Polymer and other mobility-control approaches seek to change how readily the injected phase moves, which may help where fluid mobility contributes to an unfavourable front. Screen them for fluid and rock compatibility, injectivity, handling requirements and operating demands. Infill wells or pattern changes may be relevant if evidence points to unswept areas and suitable access, but they also depend on reservoir connectivity and development constraints.
Use the comparison below to structure screening, not to rank methods universally. Each option needs a defined hypothesis and indicators that can be monitored against the pre-intervention baseline.
| Option | Mechanism and evidence needed | Operational considerations and limitations | Response indicators |
|---|---|---|---|
| Conformance control | Targets disproportionate flow through an interval; supported by profile or well-level evidence of uneven injection. | Depends on completion access and the ability to affect the dominant pathway; may not address broader pattern issues. | Injection distribution by interval, pressure response and production changes in affected wells. |
| Injection-profile or rate adjustment | Changes allocation or injection conditions; requires injection, pressure and completion data. | Constrained by injectivity, pressure limits and facility capacity; a rate change alone may not correct underlying heterogeneity. | Injection by well or interval, pressure trends, production response and water cut. |
| Infill or pattern change | Targets areas supported by evidence of limited contact; requires geological, connectivity and production assessment. | Depends on access, reservoir continuity and development feasibility; new contact is not assured. | Response from the target area, pressure communication and changes in pattern production. |
| Mobility control | Seeks to modify injected-fluid mobility; requires compatibility and injectivity screening. | May add handling and operating complexity, and suitability is reservoir-specific. | Injection behaviour, pressure, water cut and production response relative to baseline. |
Advance options that fit the diagnosed cause, available evidence and operating envelope, then define measurable response criteria before execution. For a broader perspective on evaluating conventional assets and enhanced recovery, explore Decimus Oil’s resource development approach.
A practical workflow for implementing and monitoring sweep improvements
A technically plausible intervention still needs a clear hypothesis, practical screening and a way to assess its response. A staged process keeps oil reservoir sweep efficiency improvement tied to the diagnosed flow problem while making uncertainty and operating constraints visible before implementation.
Set a baseline and choose measurable indicators
Before acting, record relevant production, injection, pressure and water-cut measures under documented operating conditions. Choose indicators that relate directly to the proposed mechanism. For example, if the hypothesis is uneven injection between intervals, track the relevant injection distribution and associated pressure and production response, rather than relying on total field production alone.
Then move through the decision in stages:
- Define the hypothesis: State the flow problem the intervention is intended to address and the evidence supporting it.
- Screen feasibility: Assess reservoir and fluid compatibility, data confidence, facility capacity, pressure constraints, execution demands and uncertainty.
- Evaluate economics: Test how the decision changes under different production-response assumptions, timing and operating conditions. Avoid relying on a single optimistic case.
- Plan execution and monitoring: Identify the measures, observation period and operating records needed to evaluate the intended response.
- Reassess: Compare observed performance with the baseline and hypothesis, then continue, adjust or reconsider the approach.
Document concurrent well work, rate changes and other operating changes that could affect interpretation. Don’t label a response an intervention-driven recovery uplift before field evidence supports that conclusion.
Use results to refine the next decision
After implementation, compare observed injection, pressure, production and water-cut behaviour with the pre-intervention baseline. Consider whether the change is consistent with the mechanism expected to improve flow distribution. Separate the intervention’s possible effect from operational changes and natural production variation. Where evidence is inconclusive, carry that uncertainty into the next decision.
Monitoring is not only a test of execution. It also updates the understanding of reservoir connectivity and confidence in the original diagnosis. That learning can inform whether to maintain the change, modify it or screen a different option. For a broader view of how technical assumptions fit into asset screening, consult the existing guide on oil and gas exploration economics.
This disciplined approach aligns with Decimus Oil’s focus on conventional oil and gas exploration, resource development and enhanced oil recovery. Sound technical screening connects the potential to improve reservoir performance with operational efficiency, while keeping decisions grounded in evidence rather than assumed outcomes.
Turn reservoir insight into disciplined asset decisions
Effective oil reservoir sweep efficiency improvement starts with identifying how injected fluids move through the reservoir, then matching an intervention to the evidence. Sweep and displacement describe different parts of recovery, while geology, fluid mobility and operating conditions shape where contact occurs. Production, injection, pressure and water-cut trends are most useful when assessed together, tested against competing explanations and compared with a clear baseline.
From there, screen options against reservoir fit, operating constraints, uncertainty and economic sensitivity. Define response measures before implementation, then use field results to refine the next decision. This disciplined approach supports more confident evaluation of opportunities to optimize existing assets without assuming a particular recovery outcome.
Decimus Oil focuses on conventional exploration and resource development, enhanced oil recovery and managing energy infrastructure to support resource development. The company’s team brings over 100 years of combined experience. Explore Decimus Oil’s approach to resource development and asset optimization to learn more about its priorities.
With sound diagnosis and measurable follow-through, operators can make each reservoir decision more purposeful and build a stronger foundation for responsible resource development.
Frequently Asked Questions
What is oil reservoir sweep efficiency?
Oil reservoir sweep efficiency describes the proportion of reservoir volume contacted by injected fluid, such as water or gas. It differs from displacement efficiency, which describes how effectively that fluid displaces oil from the pore space it contacts. Broad contact does not mean all oil in those pores is recovered, and efficient pore-scale displacement in a narrow path doesn’t mean the whole reservoir is swept. Recovery factor is a separate measure of produced oil relative to original oil in place.
What causes poor sweep efficiency in an oil reservoir?
Poor sweep can arise when reservoir geology and operating conditions steer injected fluid along preferential paths. Permeability contrasts, layering, connected fractures, unfavourable fluid mobility, injection distribution and completion configuration can all contribute. For example, fluid may move quickly through a more conductive interval while adjacent zones receive less contact. Similar production symptoms can have different causes, so compare production, pressure, injection, geological and well data before selecting an intervention.
How can operators identify poor reservoir sweep?
Operators investigate potential sweep problems by comparing production and injection trends, water-cut changes, pressure behaviour, completion information and geological connectivity. Tracer testing and interwell response may help assess communication between wells, while reservoir simulation and history matching can test competing flow hypotheses. No single indicator proves poor sweep. A robust diagnosis brings together independent evidence, checks data quality and operating changes, and establishes a baseline against which any intervention can be assessed.
Can waterflooding improve reservoir sweep efficiency?
Waterflooding can support pressure maintenance and displace oil, but its sweep effectiveness depends on reservoir properties, injection distribution, fluid behaviour and operating conditions. Injected water may follow preferential pathways, leaving other oil-bearing zones less contacted. The key question is whether the waterflood reaches the intended reservoir volume, not simply whether water is being injected. Use field evidence, including injection, pressure and production behaviour, to assess whether an adjustment is warranted.
Which methods can improve oil reservoir sweep efficiency?
Potential methods include conformance control, injection-profile or rate adjustments, mobility-control approaches such as polymer injection, and changes to well or pattern configuration. Each targets different flow problems and has distinct compatibility, data and operating requirements. For example, an injection adjustment may address uneven distribution, while a pattern change may be considered where evidence indicates poorly contacted areas. Compare options against the diagnosed mechanism and define response indicators before implementation.
How is sweep efficiency measured in an oil reservoir?
Sweep efficiency is assessed by interpreting reservoir and well evidence, rather than relying on one universal field measurement. Engineers may use injection and production histories, pressure response, tracer results, geological models, simulation and history matching. The suitable combination depends on the reservoir question and the available data. Any estimate should state its assumptions and uncertainty. Modelled fluid contact is an interpretation, not the same as directly observed field performance.
Does higher water production always mean poor sweep efficiency?
No. Higher water production or a rising water cut can prompt investigation, but neither proves poor sweep on its own. Changes may relate to well conditions, completion effects, operating changes or reservoir connectivity. Compare the water trend with injection and pressure behaviour, geological information and production history. If several explanations remain plausible, test them before choosing an intervention. A clear baseline also helps distinguish the later response from normal operating variation.


