

What if higher production is masking a less efficient asset? For Canadian operators, oil production efficiency isn’t measured by volume alone. Compare saleable output with the energy, operating time, maintenance and other inputs needed to deliver it. A well may produce more while requiring additional energy, intervention or facility capacity, so a single production rate rarely tells the whole story.
Assessing performance can be challenging when assets differ in production stage, infrastructure and operating conditions. This guide explains practical measures of oil production efficiency, what they reveal and how to compare them in context. You’ll learn how reliability planning, infrastructure use and enhanced oil recovery can affect performance, and how to assess the trade-offs. It also outlines a repeatable way to prioritize improvements across an asset’s lifecycle, linking day-to-day operating decisions with disciplined resource development and long-term asset value.
Key Takeaways
- Separate production volume, recovery factor, operating efficiency and economic performance before evaluating an asset.
- Trace constraints from reservoir and well performance through facility capacity and transportation to find what limits saleable output.
- Weigh production gains against uptime, energy use, water handling, decline and operating requirements.
- Use a consistent workflow to set a baseline, identify constraints, compare options and measure results after changes.
- Connect efficiency decisions with the asset’s lifecycle, including the role of enhanced recovery and infrastructure in resource development.
What oil production efficiency means beyond producing more barrels
Oil production efficiency describes the saleable oil an asset delivers relative to the resources, energy, time and capital required to produce it. This puts output and the inputs needed to achieve it in the same frame. A higher daily rate, by itself, cannot show whether an asset is operating more efficiently.
Several related measures answer different questions. Production volume records how much oil is produced over a defined period; it does not show what it took to produce it. Recovery factor estimates the proportion of the oil originally in place that is ultimately recovered. Operating efficiency considers how effectively an operation uses inputs such as energy, labour, equipment and time. Economic performance considers whether production and costs support value under the asset’s commercial assumptions. These measures inform one another, but they are not interchangeable.
A short-term production increase may require more energy, intervention or facility capacity, or change the rate at which a reservoir declines. It may still be a sound decision if the additional saleable output and its expected duration justify the associated inputs and effects on future production. The broader context of oil depletion matters too: production from a well or field can change as its resources are developed. Compare rates with the asset’s lifecycle in mind.
Which measures show whether production is becoming more efficient?
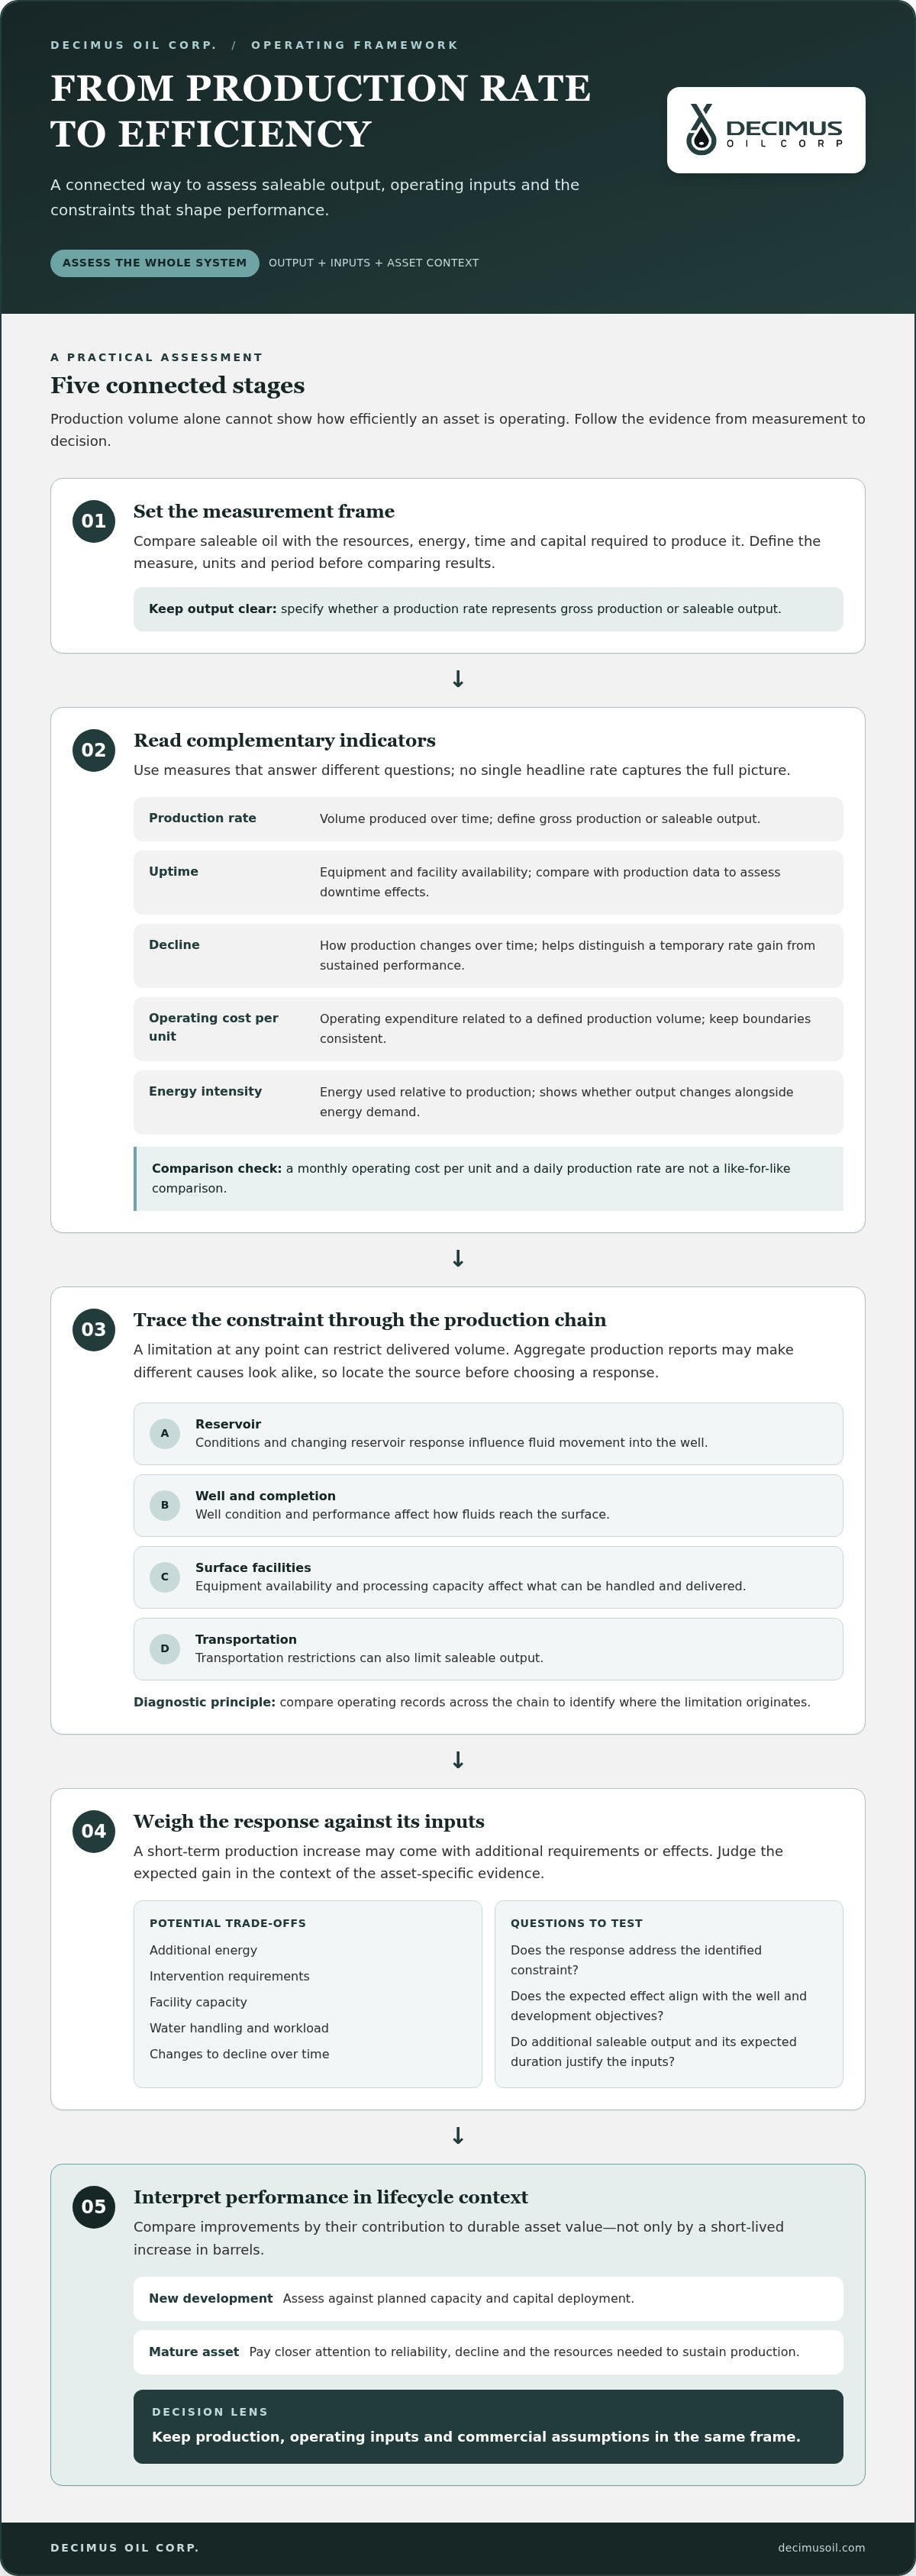
Use complementary indicators rather than relying on a single headline rate. Define each measure, keep units consistent and state the measurement period. For example, monthly operating cost per unit and a daily production rate do not provide a like-for-like comparison. Choose measures based on the asset data available and the decision you need to make.
- Production rate: Shows volume produced over time. Specify whether the figure represents gross production or saleable output.
- Uptime: Indicates how consistently equipment and facilities are available to operate. Compare it with production data to assess the effect of downtime.
- Decline: Tracks how production changes over time. Use it to distinguish a temporary rate gain from a sustained change in performance.
- Operating cost per unit: Relates operating expenditure to a defined production volume. Keep cost and volume boundaries consistent when comparing results.
- Energy intensity: Measures energy used relative to production. It can show whether a change in output is accompanied by a change in energy demand.
Why production efficiency matters across an asset lifecycle
Reliable production and controlled inputs make it easier to evaluate asset performance over time. The focus can shift as an asset matures: a new development may be assessed against planned capacity and capital deployment, while a mature asset may call for closer attention to reliability, decline and the resources needed to sustain production. Lifecycle context helps operators judge improvements by their contribution to durable asset value, not just by a short-lived increase in barrels.
How reservoir, well, and facility choices shape oil production efficiency
Saleable production depends on a connected system. Reservoir conditions influence how fluids move into a well. The well and its completion affect how effectively those fluids reach the surface. Facilities then separate, treat and move production within their capacity. A constraint at any point can limit delivered volume, even when other parts of the system are operating well. To improve oil production efficiency, identify where the limitation originates before choosing a response.
A production shortfall might reflect reservoir behaviour, a well issue, a processing bottleneck or a transportation restriction. These causes can look similar in an aggregate production report, but they call for different investigations. Break the production chain into stages and compare operating records to locate the constraint. This helps avoid adding inputs through an intervention that does not address the underlying issue.
Reservoir and well performance as production constraints
Pressure, fluid properties and the reservoir’s response over time shape the flow a well can deliver. Well condition and performance matter too: an observed rate may reflect the well’s current operating state rather than the reservoir’s full potential. Interpret decline patterns alongside operating history and the objective for the well, rather than treating the rate trend in isolation.
Consider operational changes in light of that evidence. Artificial lift, for instance, may affect how fluids are brought to the surface, while water handling requirements can influence system capacity and workload. Neither a particular method nor a higher rate is automatically appropriate. The decision depends on asset-specific conditions and whether the expected effect aligns with the well and development objectives. For a distinct discussion of recovery approaches, see enhanced oil recovery techniques.
Facility reliability, energy use, and production losses
Once fluids reach the surface, equipment availability and processing capacity affect how much can be handled and delivered. Water handling uses facility capacity; maintenance may take equipment out of service; and energy demand changes the inputs associated with production. Process control can help operators understand whether equipment is operating within intended conditions, provided measurements are reliable and the system is assessed as a whole.
A production restriction limits the rate that can be processed or moved, even when equipment is available. A reliability issue is unplanned or extended equipment downtime that reduces availability. The distinction matters: increasing capacity won’t resolve recurring equipment failures on its own, and maintenance won’t remove a persistent processing bottleneck.
Avoidable downtime reduces realized production during the period it occurs, so measure its impact against a defined operating baseline. Compare downtime records with production, maintenance and energy data to investigate the cause and scale of the loss. The Drilling Productivity Report from the U.S. Energy Information Administration provides a reference for examining drilling productivity trends. Its U.S. regional analysis is not a direct benchmark for a Canadian asset.
These connected decisions are central to Decimus Oil Corp.’s focus on resource development and energy infrastructure. Its conventional exploration and enhanced recovery focus reflects the importance of considering subsurface potential alongside the systems needed to realize asset value.
How to compare efficiency improvements without confusing output and value
Judge an improvement against what the asset would otherwise have delivered, not a production figure in isolation. Compare each proposal with a documented baseline. Track additional output alongside any change in uptime, energy intensity, water handling, decline, operating complexity and capital requirements. This helps show whether a higher rate is a durable operational gain or shifts inputs and risk elsewhere.
A useful efficiency comparison requires a consistent baseline and measurement period. Keep the production basis, units, time window and relevant operating conditions consistent across alternatives. Separate incremental production from baseline output, and record which inputs change. If comparable data is unavailable, state the data gap rather than inferring an outcome.
Compare interventions using consistent measures
Use a simple comparison table to make assumptions visible before deciding. The entries below are prompts, not forecasts; populate them with measured asset-specific results or clearly labelled estimates. For example, a proposal focused on uptime should show both the production associated with reduced downtime and the maintenance or operating inputs required to achieve it.
| Comparison element | What to record |
|---|---|
| Baseline | Measured production, uptime and operating inputs over a defined period, with units and production basis stated. |
| Proposed change | The intervention being considered and the operating conditions it is intended to address. |
| Expected measure | Forecast or target for production rate, uptime, energy intensity, water handling or decline. Label it as a forecast or target, not a measured result. |
| Operating input | Expected changes in energy, maintenance, water handling, operating complexity and capital requirements. |
| Uncertainty | Key assumptions, data limitations and factors that could affect the production response or duration of the result. |
After implementation, compare actual results with both the baseline and the forecast. Keep measurement periods aligned and note material changes in operating conditions. Separating observed performance from expectations helps show whether a gain persisted or coincided with other changes.
Account for trade-offs, uncertainty, and asset context
The highest projected production rate may not be the most efficient choice for every asset. One option could increase output while also raising energy demand, water volumes, maintenance needs or operating complexity. Another might produce a smaller rate change but improve uptime or fit existing infrastructure more effectively. Assess the combined production response and inputs against the asset’s objectives and lifecycle. Distinguish measured evidence from assumptions.
Infrastructure can shape those trade-offs: processing or transportation capacity may determine whether incremental production becomes saleable output. Include energy infrastructure management in the asset-level comparison. The Society of Petroleum Engineers provides industry resources relevant to evaluating technical approaches. Use those resources to inform, not replace, asset-specific data.
Disciplined comparison supports better resource development decisions. Decimus Oil Corp.’s focus on resource development and energy infrastructure reflects the importance of considering production alongside the systems and inputs that contribute to asset value.
A practical workflow for diagnosing and improving production efficiency
A repeatable diagnostic process turns operating data into focused decisions. The aim isn’t to pursue every available change. Identify the constraint that matters, test a response against a defined objective and confirm whether the results justify the decision. The cycle below separates evidence gathering from action while keeping operational control and asset planning in view.
- Establish a baseline. Define the asset boundary, production basis, units and measurement period. Assemble production, downtime, energy, water and maintenance records for that same period. Check that the data is complete and that operating conditions are comparable enough to support a useful reference point.
- Locate the constraint. Look for relationships across records instead of treating each measure in isolation. A production dip that coincides with equipment downtime may call for a different investigation from a sustained decline without a reliability event. Verify the likely cause before selecting an action.
- Compare options. Rank potential responses by strength of evidence, expected operational effect, complexity and uncertainty. Identify which actions fall within routine operational control and which depend on facility capacity, transportation or wider asset planning. Make assumptions and required inputs explicit.
- Implement with a defined objective. State what the change is intended to improve, how success will be measured and over what monitoring period. Record starting conditions and implementation details so results can be interpreted against the original baseline.
- Measure again and review. Compare actual production, downtime, energy, water and maintenance outcomes with the baseline and stated objective. Record unintended effects as well as gains. Decide whether to retain, adjust or discontinue the change, and apply the findings to future asset decisions.
Build a trustworthy operating baseline
Set the boundary before calculating performance. Clarify which wells, facilities or processes are included, and use consistent units and time intervals. Identify the source for each measure, then check for missing entries, changes in downtime coding and shifts in operating conditions that could distort a comparison. Use verified asset records, not unsupported industry-wide assumptions or sample figures, to establish the reference point.
Prioritize and monitor an improvement
Prioritize actions based on the quality of the evidence and their practical scope. A response to a recurring, documented equipment issue may be easier to test than a proposal that depends on future infrastructure changes. Before implementation, define the expected operational effect and monitoring period. Afterwards, capture side effects and uncertainty alongside the main result.
This disciplined cycle supports resource development by linking operating choices with asset-level evidence. Learn more about Decimus Oil Corp.’s approach to resource development and energy infrastructure on its corporate site.
How disciplined efficiency supports resource and asset development
Efficiency creates value when operating decisions are assessed in the context of the whole asset. Consider production, operating inputs, reliability and asset conditions together, then weigh them against the resource-development objective. This approach to oil production efficiency avoids treating a short-term rate increase as proof of lasting improvement. It also gives decision-makers a disciplined basis for setting priorities as an asset moves from development through production and into maturity.
The same operating change can have different implications across assets. A well-level adjustment may be relevant when the constraint is local, while a facility or transportation limitation may call for broader planning. Start with evidence about the asset and the intended outcome, then consider how the decision fits with other wells, facilities and infrastructure. This approach clarifies assumptions, trade-offs and uncertainties without promising a particular result.
Efficiency as part of conventional resource development
In conventional resource development, operational assessment can help determine where further attention is warranted and how well, facility and infrastructure decisions relate to the asset lifecycle. Consider a change intended to improve one part of the production system in light of its effects on reliability, operating requirements and the ability to realize value from the resource. These considerations help shape development priorities without prescribing a specific intervention or recovery outcome.
Efficiency is one input to broader development decisions, not a substitute for assessing geology, technical feasibility or commercial assumptions. Exploration economics involves separate questions about risk, investment and value drivers; the discussion of oil and gas exploration economics addresses those considerations. Keeping the topics distinct helps connect operational performance with strategy without treating an operating measure as an economic conclusion.
Decimus Oil Corp.’s strategic focus and further reading
Decimus Oil Corp. focuses on conventional oil and gas exploration, resource development, enhanced oil recovery and energy infrastructure. These areas are relevant to an asset-level view of production: resource development considers how assets are advanced, enhanced recovery relates to recovery potential, and infrastructure is part of the system that supports production and delivery. They describe the company’s strategic focus, not specific project results, deployed technologies or operating performance.
Decimus Oil Corp. is publicly traded on the TSX Venture Exchange as TSXV:WCSB, and the company reports more than 100 years of combined team experience. These corporate facts provide context about the organisation, but they are not evidence of a particular production result. The central principle remains disciplined assessment: connect operating evidence to asset conditions, weigh trade-offs and use findings to inform resource-development priorities over time.
For more context on the company’s resource-development focus, learn about Decimus Oil Corp..
Turn operational insight into disciplined action
Make efficiency assessment part of the asset’s regular decision cycle. Choose a priority where better evidence could change an operating or development decision, then assign responsibility for tracking relevant measures and reviewing the result. This creates a practical link between day-to-day operations and longer-term planning, and helps teams distinguish a promising idea from a change that delivers sustained value.
For Canadian operators, disciplined oil production efficiency means grounding decisions in the asset’s operating context and revisiting assumptions as conditions change. This supports careful resource development without treating production growth as the only measure of progress. Consistent evaluation can help direct attention and capital toward opportunities that align with an asset’s objectives.
Decimus Oil Corp. focuses on conventional exploration, resource development, enhanced oil recovery and energy infrastructure. Learn about Decimus Oil Corp. and its resource-development focus.
Frequently Asked Questions
What is oil production efficiency?
Oil production efficiency describes the relationship between saleable production and the resources, time, energy and operating effort required to deliver it. It isn’t one universal metric; operators select measures suited to the asset and decision being assessed. For a useful comparison, define what the asset boundary includes, use consistent units and compare equivalent time periods. This helps distinguish an operating change from differences in how figures were calculated.
How is oil production efficiency measured?
Operators may assess production rates, uptime, decline, energy intensity, water handling and operating cost per unit. No single indicator describes every asset. A rate increase, for example, may coincide with higher energy use or more water to manage. Choose measures that fit the decision, define the asset boundary and report over consistent periods. Figures based on different assumptions, operating conditions or reporting intervals shouldn’t be treated as directly comparable.
Does higher oil production always mean better efficiency?
No. A higher rate can indicate improved performance, but it doesn’t establish that the whole asset is more efficient. The increase may require additional energy or operating effort, coincide with more downtime or be constrained by facilities. Decline and the value of incremental output matter too. Compare results with a clear baseline and the intervention’s objective, then assess whether the change persists over the measurement period.
What does uptime tell operators about production efficiency?
Uptime is the share of a defined period during which equipment or an operation is available to perform its intended function. It can help identify production losses associated with reliability, such as recurring equipment outages. However, high uptime doesn’t measure reservoir potential or establish overall economic performance. For meaningful comparisons, use consistent downtime categories and records, and specify which equipment or operating system the calculation includes.
How can energy use affect oil production efficiency?
Energy is an operating input across production and processing, so energy intensity can indicate how much energy is associated with a unit of output. A change in production conditions, for instance, may alter energy use even if the facility boundary stays the same. Define which processes and energy sources are included, then interpret the measure alongside output, reliability and operating conditions. A change in energy intensity alone doesn’t explain why performance shifted.
What is the difference between production efficiency and recovery factor?
Production efficiency concerns how effectively an operation delivers output relative to its inputs and constraints. Recovery factor describes the proportion of an estimated resource ultimately recovered. The measures address connected but distinct questions: one focuses on operating performance, the other on recovery over the resource’s development. A short-term production-rate improvement may affect current output without demonstrating that the estimated recovery factor has changed.


