
Upstream is where oil and natural gas value begins: an upstream oil and gas company in Canada explores for resources, extracts them and produces them for the energy market. Canada produced an average of 5.76 million barrels of oil per day in 2023 and was the world’s fourth-largest oil-producing country as of 2024. Those figures show the scale of the sector, but they don’t tell you how individual producers compare.
Revenue and market capitalization show different aspects of a company’s scale. Revenue measures sales over a reporting period; market capitalization reflects the market value of its outstanding shares. Growth, asset mix and exposure to different parts of the energy sector add useful context, so compare more than one measure rather than relying on a single ranking.
This article explains what upstream companies do and compares Canadian producers by revenue, growth, sector coverage and market capitalization. You’ll learn how to interpret these measures side by side, what they reveal about each company, and why the largest producer by one measure may not lead by another.
Key Takeaways
- Distinguish producers focused on exploration and production from companies with broader energy-sector operations before comparing their scale.
- Read revenue growth alongside production, commodity prices and changes in asset portfolios to understand what may be driving the results.
- Compare market capitalization as a snapshot of investor valuation, not as a substitute for operating performance or revenue.
- Use consistent reporting periods and company disclosures to make rankings more meaningful across Canadian producers.
- Assess how each company’s assets and sector coverage align with the investment exposure you’re seeking.
2. Canadian upstream oil and natural gas industry
Upstream companies explore for resources, extract them and produce oil and natural gas. Their work begins with assessing geological prospects, then moves through drilling, field development and ongoing operations. A Canadian producer may focus on crude oil, natural gas, natural gas liquids or a combination. Its product mix and asset base help define its place in the energy market.
Canada averaged 5.76 million barrels of oil per day in 2023 and ranked as the world’s fourth-largest oil-producing country as of 2024. Those figures show national production scale, but not each company’s contribution. Company output depends on operated assets, ownership interests, resource type and development activity. Exploration can build future opportunities, while producing fields generate current volumes.
Crude oil includes distinct streams, such as light crude, which is generally less dense than heavier crude. Natural gas liquids, or NGLs, are hydrocarbons separated from natural gas during processing, including ethane, propane and butane. A producer’s product mix may therefore extend beyond crude and sales gas. Compare oil, gas and NGL volumes as separate categories.
Natural gas can also differ by market destination and stated attributes. “Certified natural gas” refers to gas associated with verification claims, so the scope of a certification matters. Examine which attributes it covers and which parts of production or the supply chain are addressed. A certification label alone does not describe a producer’s full operations or resource mix. Company disclosures provide context for how such claims relate to producing assets.
Some Canadian energy companies report activities beyond upstream production. Imperial Oil Ltd., incorporated in 1880, is one company investors may encounter in sector comparisons. Its corporate identity or history doesn’t by itself establish how much of its business comes from exploration and production. Review segment disclosures to distinguish upstream activity from other reported operations before comparing revenue or scale.
For a practical comparison, start with each company’s reported products and operating footprint. Separate exploration and development activity from producing assets, then note whether the company operates in other parts of the energy sector. This helps distinguish an active producer from an explorer developing its portfolio or a broader energy company. Consistent categories make revenue and valuation comparisons more useful.
3. Company revenues and revenue growth
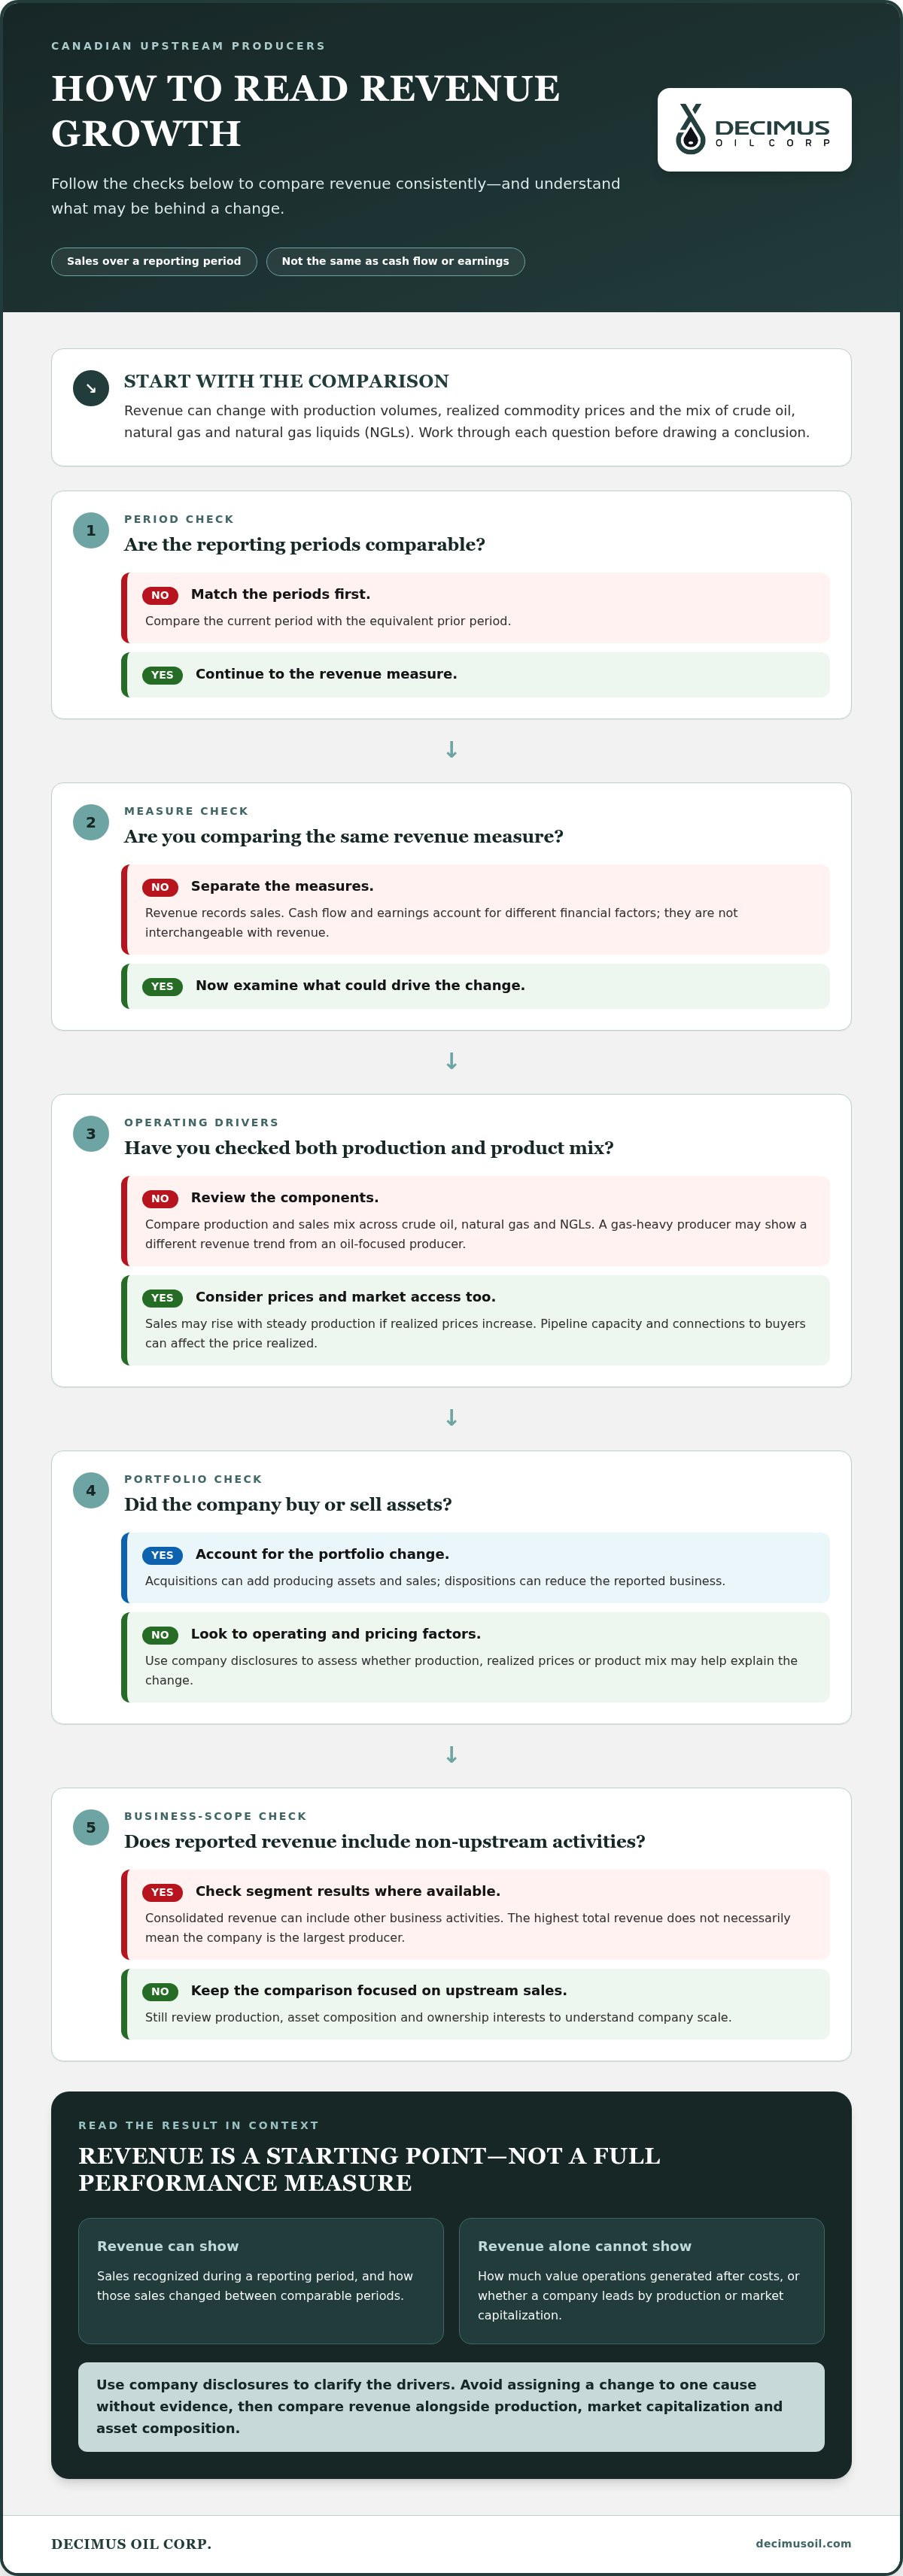
Revenue records the value of sales recognized during a company’s reporting period. For Canadian producers, it can change with production volumes, realized commodity prices and the mix of crude oil, natural gas and natural gas liquids. Sales may rise while production stays steady if realized prices increase. Conversely, lower prices or reduced sales volumes can weigh on revenue even when the underlying assets are unchanged.
Start with comparable reporting periods and the same revenue measure. Then distinguish reported revenue from cash flow and earnings, which account for different financial factors. This prevents treating sales as a complete measure of operating performance. For example, revenue may grow while costs also rise, so the sales figure alone cannot show how much value operations generated.
Read revenue growth by identifying its drivers. Compare the current period with the equivalent prior period, then look for changes in production, commodity prices and the company’s portfolio. Acquisitions can add producing assets and sales, while asset dispositions can reduce the reported business. Company disclosures help clarify whether growth came from operations, pricing or a change in ownership.
Product mix also shapes results. A producer with substantial natural gas sales may show a different trend from an oil-focused producer in the same reporting period. Transportation access can affect the price realized for production. Pipeline capacity and connections to buyers influence market access, so consider the route to market as well as the volume and type of products sold.
Integrated energy companies need a segment-level review. Consolidated revenue may include upstream production and other business activities. If you’re comparing exploration and production, use reported segment results where available. The company with the highest total revenue may not be the largest producer, because its sales can include businesses outside upstream operations.
Use a consistent sequence: match reporting periods, identify the revenue definition, examine product mix, then review production and portfolio changes. If revenue rises while production remains stable, price movements or a change in business mix may help explain the difference. If both increase, production growth may be a factor. Company disclosures provide context, but avoid attributing a change to a single cause without evidence.
Revenue is a useful starting point, not a complete ranking of Canadian producers. Compare it with production, market capitalization, asset composition and growth drivers. Also consider whether reported production reflects the company’s operated share or its total interest in an asset, since ownership structures affect results. This approach separates company scale from period-specific momentum and supports a more disciplined comparison.
4. Canadian upstream sector coverage
Canadian producers differ in operating scope, resource mix and asset ownership. An exploration and production company focuses on finding and producing hydrocarbons. An integrated energy company may also report activities beyond upstream production. These distinctions shape how investors interpret revenue, reserves and operating scale across the sector.
The active Canadian-based exploration and production company list is current as of Dec 8, 2025. It helps identify companies for comparison, but a directory alone cannot show how their assets differ. Review each company’s operating regions, producing properties, exploration plans and ownership interests. These details distinguish established production from acreage or projects still being developed.
The top 10 Canadian E&P companies employed 41,124 people in 2021 and held total reserves of 29,256 MMboe in 2021. MMboe expresses reserves in million barrels of oil equivalent. Together, these figures indicate the workforce and reserve scale represented by leading producers at that time. They don’t show each company’s individual share, asset quality or current operating profile.
Ownership and operatorship also affect what a company’s figures represent. A company may hold an interest in an asset without operating it directly, while partners share project interests and responsibilities. Compare operated production with total reported production, and note whether figures include the company’s share of joint ventures. This helps prevent unlike ownership structures from being treated as equivalent.
Infrastructure adds another dimension to a producer’s footprint. Production needs connections to processing and markets, and pipelines can shape how assets reach buyers. One company may report upstream properties alongside related infrastructure, while another relies on third-party systems. Identify the infrastructure a company owns or operates, and distinguish it from external arrangements described in its disclosures.
Imperial Oil Ltd. illustrates why sector labels need careful interpretation. Its corporate results may include activities beyond exploration and production, so total company figures do not necessarily represent upstream performance alone. Examine segment disclosures and ownership descriptions to understand which operations are part of the upstream business. When assessing producers, compare equivalent segments and reporting periods.
Use a consistent checklist when reviewing Canadian companies: identify their exploration and production focus, note their operating footprint, distinguish owned from operated assets, and record partner interests. Then assess whether infrastructure or other business segments broaden their coverage. This provides a more precise view of sector participation than a ranking based only on corporate size.
5. Market capitalization and company rankings
Market capitalization estimates the stock market value of a public company’s outstanding shares. It is calculated by multiplying the share price by the number of shares outstanding. Unlike revenue, which records sales over a reporting period, market capitalization reflects investor valuation at a particular moment. Keep these measures distinct when comparing Canadian producers.
Market-capitalization rankings can change as share prices and share counts change. A company may move in a ranking without changing its producing assets or reported sales. For a fair comparison, record the date of each market-cap figure and use the same date across companies. Also establish whether the ranking covers producers only or broader oil and natural gas businesses.
Imperial Oil Ltd. illustrates why company identity and sector scope matter. Imperial Oil was incorporated in 1880, but its history alone does not determine its current market value or upstream position. Review its business segments and reported operations before comparing it with a producer focused primarily on exploration and production. Corporate age, revenue and market capitalization describe different dimensions of a company.
Follow a consistent comparison sequence. First, identify each company’s listing and share structure. Next, match the dates used for market capitalization. Then compare market capitalization with revenue, production and asset coverage. If a company has multiple business segments, examine its disclosures to understand how its oil and natural gas operations fit within the broader enterprise. This makes the ranking more informative.
An acquisition can reshape a company’s scale, asset mix and share count, so compare rankings alongside corporate developments. The same caution applies to environmental disclosures. Canada’s federal government passed omnibus Bill C-59 in June 2024, including amendments to the Competition Act concerning environmental communications. Investors assessing company statements should distinguish reported operating facts from environmental claims and consider the wording in context.
Market value does not directly measure reserves, production efficiency or future growth. A western Canadian producer with a smaller valuation may have a different asset profile from an integrated company with broader operations. Compare the underlying businesses, not just their positions in a league table. A useful ranking states its date, company scope and chosen metric, then explains how market capitalization relates to operating measures.
For investors, the practical takeaway is to treat market capitalization as one comparison lens. Pair it with revenue trends, production mix and sector coverage to assess what the market is valuing. Rankings can indicate relative scale, but a company’s assets, operations and reporting provide the context needed to interpret its position.
5. What are the largest upstream oil and gas companies operating in Canada?
No single ranking answers “largest” for every purpose. Revenue, market capitalisation, production and reserves measure different aspects of company scale. Suncor Energy Inc. and Imperial Oil Ltd. are major enterprises to compare alongside other producers, but their order depends on the metric and reporting date.
For an upstream-focused comparison, start with exploration and production operations. Suncor Energy Inc. and Imperial Oil Ltd. are relevant examples of energy producers whose results can be assessed through production, revenue and asset disclosures. These firms often maintain broader business activities, so their consolidated figures may include more than upstream performance.
That distinction matters. A company with refining or other energy operations may report revenue from activities beyond oil and natural gas production. Compare upstream segment information where available, and don’t treat total corporate revenue as a direct measure of production scale. The same principle applies to market capitalisation, which values the whole public company, not just its upstream assets.
Use a consistent method to build a useful comparison:
- Define the measure: decide whether “largest” means revenue, production, reserves or market capitalisation.
- Match reporting periods: compare figures from equivalent periods and note the date used for market values.
- Separate business segments: distinguish upstream results from refining, infrastructure or other activities.
- Review ownership: check whether reported assets are operated directly, held through partners or jointly owned.
Company rankings can shift with commodity prices, production changes, acquisitions and share-price movements. A producer’s revenue rank may differ from its market-capitalisation rank, while reserve scale does not automatically indicate current sales or operating performance. Read the underlying disclosures before drawing conclusions from a league table.
For a practical shortlist, compare prominent operators using the same operating and financial measures. Then note which figures include non-upstream activities. This gives a clearer view of how each company’s upstream business compares without implying that one ranking captures every dimension of scale.
For readers considering exposure to a Canadian energy company, reviewing a public equity investment is a separate decision from comparing producers by size. Review public equity investment details as one way to understand how a smaller public company like Decimus Oil Corp. fits into the sector.
Compare reserves and production using upstream disclosures, but treat market capitalisation as a measure of the whole public company. Different sector participants may rank distinctly on each measure, so use equivalent reporting periods and account for broader downstream or integrated operations.
Decimus Oil: Public Equity Investment (TSXV:WCSB)
Decimus Oil Corp. is a Canadian upstream oil and gas company focused on conventional exploration and resource development. Its work includes exploring and developing hydrocarbon potential in the Mannville formation, alongside energy infrastructure and enhanced oil recovery. Those assessing the company can consider how its resource-development activities fit their investment objectives.
Decimus Oil Corp. may be relevant if you are assessing a different public-company profile within the upstream sector. Consider how its focus on conventional exploration, infrastructure and enhanced recovery relates to your investment objectives, alongside the revenue, growth and market-value measures discussed above.
For more information about Decimus Oil Corp.'s public equity investment, contact Decimus Oil Corp.
Choose your next energy-sector perspective
Company comparisons are most useful when they clarify the kind of exposure you want to explore. If you’re assessing an upstream oil and gas company in Canada, consider how its operating focus, assets and public-market profile align with your investment priorities. Then review the company’s disclosures and decide which questions matter most to your analysis.
Decimus Oil connects public equity investment with conventional oil and gas exploration, energy infrastructure and enhanced oil recovery. These areas offer a focused reference for readers interested in how resource development and supporting assets fit within Canada’s energy sector. Review the company’s disclosures to understand its approach and decide whether it warrants further consideration.
Contact Decimus Oil to discuss your project and take the next step with a clearer view of your objectives.
Frequently Asked Questions
What Does It Mean to Be an Upstream Oil and Gas Company?
An upstream oil and gas company explores for and produces hydrocarbons. Its work can include assessing prospective resources, drilling wells, developing fields and managing production. For example, a company focused on conventional exploration differs from an integrated producer that also reports refining or other business segments. This distinction matters when assessing an upstream oil and gas company in Canada, because consolidated results may include activities beyond exploration and production.
Which Canadian Oil & Gas Company Is the Biggest by Revenue?
The answer depends on the reporting period and whether the comparison includes integrated energy businesses. Canadian Natural Resources Ltd. and Cenovus Energy Inc. are major producers to compare, while Suncor Energy Inc. and Imperial Oil Ltd. have broader operations that can affect consolidated revenue. To identify the leader for a particular period, compare revenue for the same period and confirm whether the figures cover the whole company or only upstream segments.
Which Canadian companies are focused on upstream oil and gas production?
Canadian Natural Resources Ltd. and Cenovus Energy Inc. are prominent Canadian producers with substantial upstream operations. Suncor Energy Inc. and Imperial Oil Ltd. also produce oil and natural gas, but their broader business activities mean total company results are not purely upstream. For a focused comparison, review each company’s segment reporting and production disclosures. This helps separate exploration and production performance from results generated by other parts of an integrated business.
How can investors compare Canadian upstream oil and gas companies?
Compare companies using the same reporting period, then assess revenue, production, growth, reserves and market capitalization as separate measures. Review segment disclosures to isolate upstream activity, and note acquisitions or changes in asset ownership that may affect comparisons. Also examine each company’s stated operating focus and infrastructure exposure. Decimus Oil shares must be purchased through a brokerage service provider; Decimus does not provide investment advice or act as a financial advisor.
How do Canadian upstream companies compare by reserves, production, and market capitalization?
The top 10 Canadian E&P companies held total reserves of 29,256 MMboe in 2021. Canada averaged 5.76 million barrels of oil per day in 2023, but that national figure does not show each company’s production. Market capitalization reflects stock-market valuation, so company comparisons require consistent company disclosures and reporting periods.
What are the main risks facing upstream oil and gas companies in Canada?
Revenue and operating results can be affected by commodity prices, production volumes, product mix, rising costs, asset changes, and access to transportation and buyers. Ownership structures and activities outside upstream production can also complicate comparisons.


