
In the Western Canadian Sedimentary Basin, operational choices shape resource development and environmental performance. A Canadian energy exploration company assesses subsurface potential, then develops resources through drilling, production and recovery, supported by infrastructure. Its environmental approach considers impacts such as land disturbance, water use and emissions, while ESG measures help show how the business manages environmental, social and governance issues.
Understanding these activities means looking beyond exploration: geology, engineering, infrastructure and recovery methods all shape an upstream operation. This article explains how Canadian companies work across the basin, manage environmental impacts and report on ESG performance. It also distinguishes operational factors from broader measures used to assess an energy business, giving you a clearer basis for understanding the sector and its role in Canada.
Key Takeaways
- Use the 2018 industry figures to understand the scale of the Canadian upstream sector: 265 active companies, including 49 with energy assets worth more than $1 billion.
- Assess environmental performance by looking at how operations manage emissions, water use and land disturbance across their lifecycle.
- Read ESG disclosures with attention to the reporting period and the environmental, social and governance measures they cover.
- Compare publicly listed upstream companies by considering their assets, operations and resource development strategy, not share-market indicators alone.
- Explore how Western Canadian Sedimentary Basin geology and infrastructure shape development choices, including recovery approaches and investment opportunities.
Canadian-based oil and gas exploration and production companies
Canadian upstream companies explore for hydrocarbons, develop discoveries and produce oil, natural gas and condensate. In 2018, 265 active Canadian energy companies operated in the sector, and 49 had energy assets worth more than $1 billion. These figures show a diverse industry, spanning smaller producers and businesses with substantial asset portfolios.
For reserves, the top 10 Canadian exploration and production companies held combined reserves of 29,256 MMboe in 2021. That figure measures the group, not an individual company’s ranking. Production rankings and reserve rankings answer different questions: production reflects output over a period, while reserves represent recoverable resources. A company can rank differently under each measure.
Natural gas and condensate production depends on the characteristics of each reservoir and the facilities connected to it. Exploration evaluates geological prospects, drilling tests them, and production systems bring gas and associated liquids to market. Gas processing separates condensate and other components, while pipelines and related infrastructure connect producing areas with buyers. Operators consider these linked steps when deciding whether a development can proceed.
Company status also changes over time. Evaluate Energy’s list of active Canadian-based exploration and production companies is stated to be correct as of December 8, 2025. Older industry records can include producers that later stopped operating, merged or changed corporate structure. Treat inactive producers as a historical snapshot, rather than assuming every past company remains an active operator.
Comparisons with U.S. companies should account for differences in assets, geology, infrastructure and market access. Canadian producers may focus on Western Canadian resources and the pipelines connecting them to customers; U.S. companies operate across a range of basins and market systems. Compare like with like using the same period and measure, such as production, reserves or free funds flow. Free funds flow is the cash remaining after operating costs and investment, so commodity prices, production levels and capital spending all affect it.
Permits and regulatory approvals depend on the province or territory, project location and proposed activity. Exploration plans may involve land access, drilling, water use and environmental review, with requirements varying by jurisdiction and project. Companies acquire mineral rights through the relevant provincial or territorial tenure process, then secure approvals for the proposed work. The location and activity determine the steps.
There is no single current Canadian oil or natural gas price: realized prices depend on the relevant benchmark, product quality, location, transportation access and contract terms. Recent project or discovery news also varies by company and reporting date. ARC Resources became a member of the Shell Group on September 2, 2026, illustrating how corporate changes can reshape the sector. For any operator, assess news alongside production, reserves and the status of its assets.
Emissions, water management and land disturbance
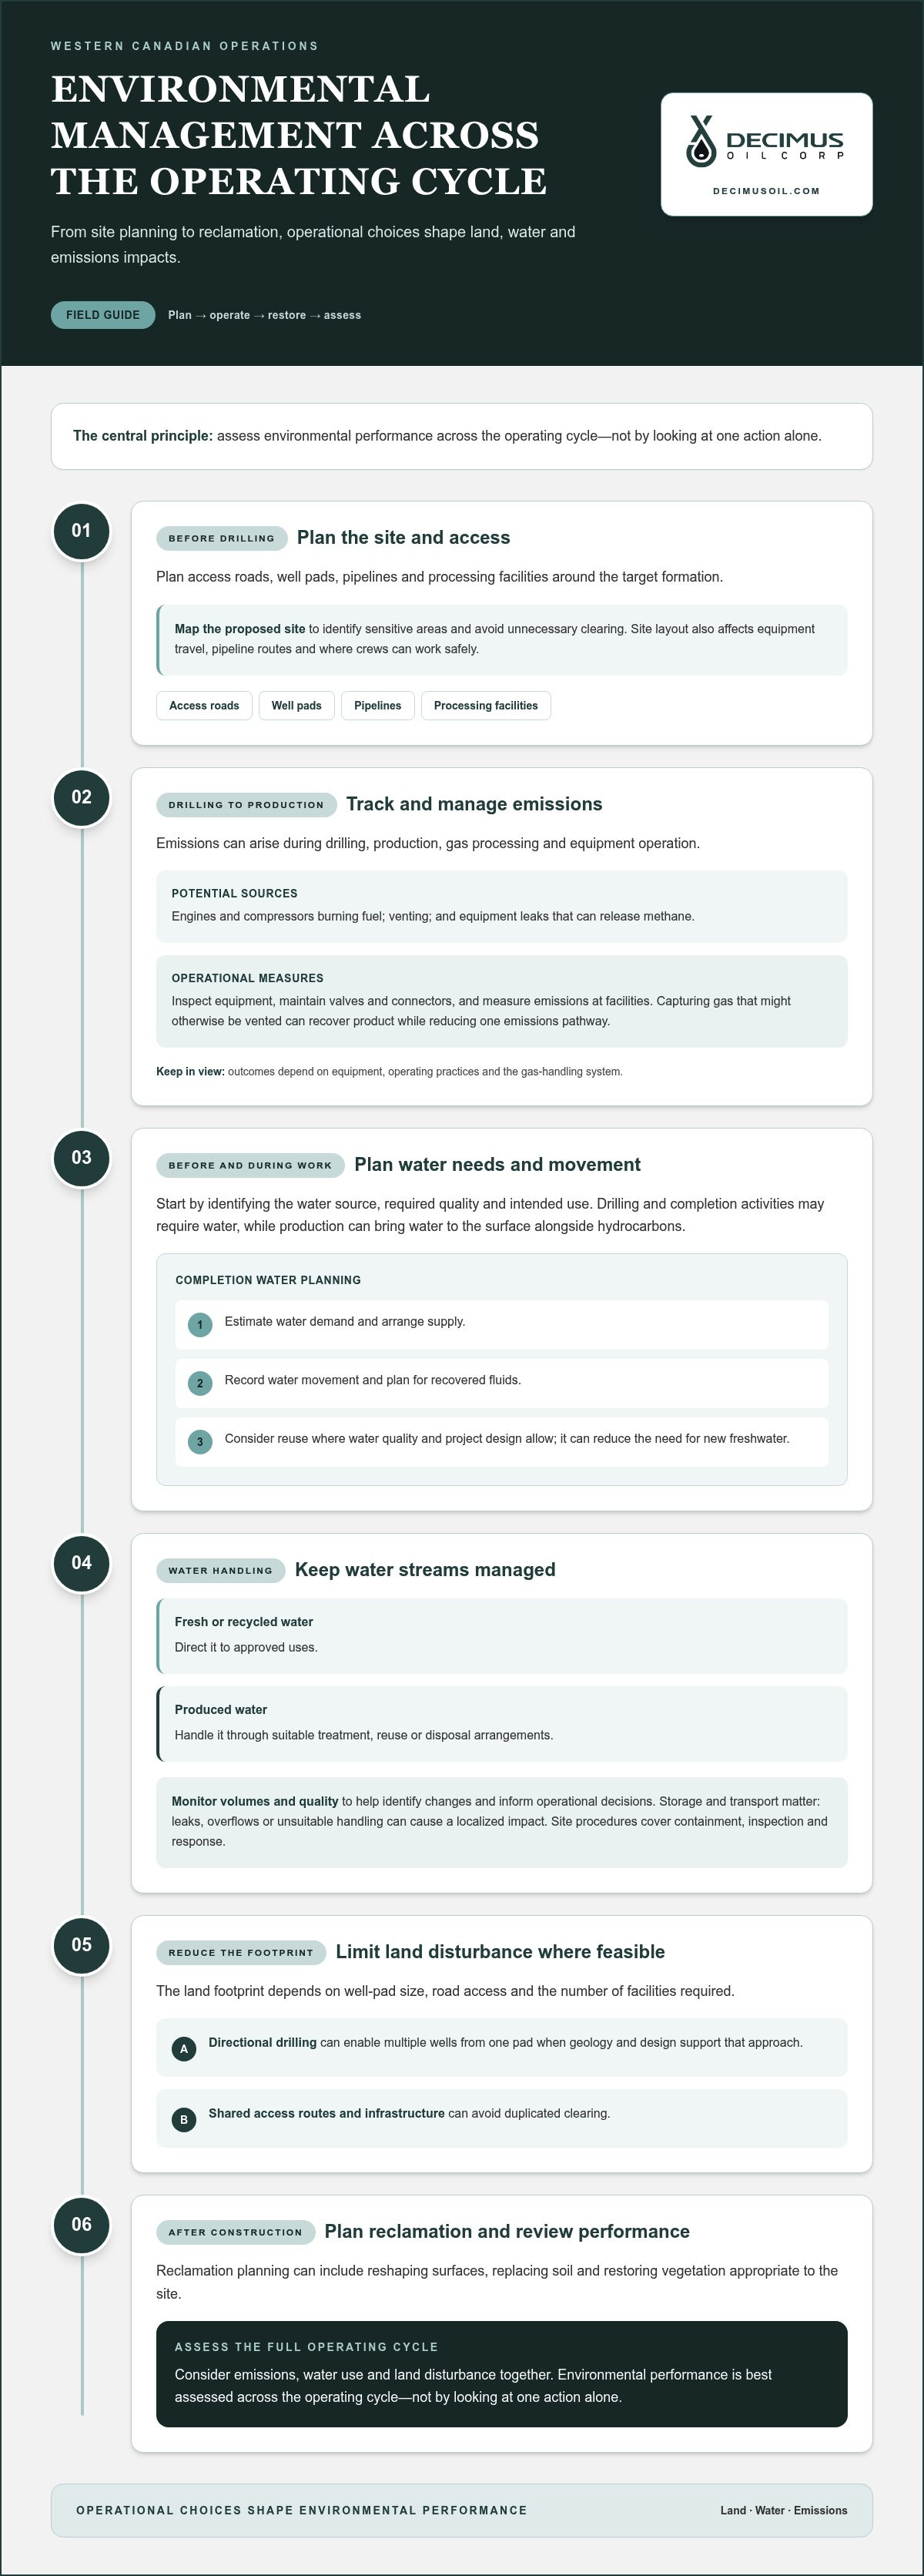
Environmental planning starts before drilling. In Western Canada, an operator plans access roads, well pads, pipelines and processing facilities around the target formation. Each site can affect vegetation, wildlife movement and soil. Mapping the proposed site helps identify sensitive areas and avoid unnecessary clearing. The layout also affects equipment travel, pipeline routes and where crews can work safely.
Emissions can arise during drilling, production, gas processing and equipment operation. Engines and compressors release emissions when they burn fuel; venting and equipment leaks can also release methane. Operators can track these sources by inspecting equipment, maintaining valves and connectors, and measuring emissions at facilities. Capturing gas that might otherwise be vented can recover product while reducing one emissions pathway. The outcome depends on equipment, operating practices and the gas-handling system.
Water planning starts by identifying the source, required quality and intended use. Drilling and completion activities may require water, while production can bring water to the surface alongside hydrocarbons. Operators manage these streams separately: fresh or recycled water goes to approved uses, and produced water is handled through suitable treatment, reuse or disposal arrangements. Monitoring water volumes and quality helps identify changes and inform operational decisions.
In a completion program, water management involves several practical steps. A company estimates demand, arranges supply, records water movement and plans for recovered fluids. Reuse can reduce the need for new freshwater when water quality and project design allow. Storage and transport matter too: a leak, overflow or unsuitable handling practice can cause a localized impact. Site procedures therefore cover containment, inspection and response.
Land disturbance depends on well-pad size, road access and the number of facilities required. Directional drilling can enable multiple wells from one pad when geology and design support that approach. Shared access routes and infrastructure can also avoid duplicated clearing. After construction, operators manage disturbed ground through reclamation planning, which can include reshaping surfaces, replacing soil and restoring vegetation appropriate to the site.
Environmental performance is best assessed across the operating cycle, not by looking at one action alone. A compact pad, for example, may reduce cleared area but still require careful water handling and emissions control. Ask whether the operator identifies impacts before work begins, monitors them during operations and records follow-up actions. Comparing practices across exploration, production and site restoration shows how environmental management informs upstream decisions.
Environmental, social and governance performance
Environmental, social and governance performance helps readers assess how an upstream operator manages impacts, relationships and oversight. Good analysis separates reported activity from measured results. A company may describe methane inspections, for example, but readers also need to know their scope, frequency and outcomes. The same distinction applies to water management, worker safety and board oversight. Clear reporting connects policies with operational evidence.
Reporting periods matter when comparing disclosures. According to ARC’s 2023 ESG Update, the report covered environmental, social and governance performance from January 1 to December 31, 2022. That period gives the figures and initiatives a defined context. Before comparing two operators, align their reporting years, organizational boundaries and calculation methods. Otherwise, apparent differences may reflect reporting choices rather than changes in performance.
Environmental indicators can include greenhouse gas emissions, methane management, water use, spills, waste and site reclamation. Check which operations and assets the figures cover, and whether the company explains changes over time. An emissions reduction is easier to interpret when reporting also describes changes in production, measurement methods and actions taken. Water disclosures are more useful when they distinguish freshwater withdrawal from reuse and produced-water handling.
Social performance concerns how operations affect workers and nearby communities. Relevant disclosures may cover safety systems, training, incident management, Indigenous engagement and community investment. A policy statement alone does not show how a company responds to concerns. Look for practical details: who is responsible for engagement, how feedback informs project decisions, and how worker incidents lead to corrective action. These details connect social commitments with operational practice.
Governance shows how decisions, controls and accountability are organized. Readers can examine board oversight, executive responsibility for ESG issues, risk-management processes and the consistency of public disclosures. A report should identify the leaders responsible for material risks and explain how performance information reaches decision-makers. For a publicly listed operator, consistent reporting also helps investors compare stated priorities with capital allocation and operational updates.
Key financial risks include uncertain discoveries, changing commodity prices, high capital requirements and disruptions to production or infrastructure. Environmental risks include emissions, water impacts, spills, land disturbance and long-term site management. These risks can overlap: an operational incident may affect production, remediation needs and community relationships. The scale of exposure depends on the assets, operating methods, location and company controls.
To assess an ESG report, check its reporting period, boundaries, indicators and explanations of changes from year to year. Then compare disclosures with operational context, such as production levels, facility changes and project activity. Treat a target as a stated objective, not a completed outcome. This disciplined review helps distinguish measurable progress from broad commitments and gives you a clearer basis for evaluating an operator’s resilience and accountability.
Publicly listed Canadian upstream companies
Public listings give investors a way to participate in upstream energy companies and assess their reported performance. The top 10 Canadian exploration and production companies employed 41,124 people in 2021, showing the sector’s substantial workforce. A listed operator’s profile depends on its assets, production, reserves, capital spending and financing. Share-market measures add another perspective, but don’t replace analysis of the underlying business.
Start with the company’s filings and identify its operating assets, production mix and development plans. Then compare these details with financial measures such as operating cash flow, capital investment and debt. Production growth, for example, can require substantial investment, so higher output alone does not prove stronger financial performance. Free funds flow shows what remains after operating costs and investment, while also reflecting commodity prices and spending choices.
Market indicators describe different aspects of a listed company. Shares outstanding represent issued equity, while public float refers to shares available for public trading. Trading volume shows how actively shares changed hands during a stated period. A price-to-book ratio compares market value with reported book value. These measures help frame a market snapshot, but they do not establish the quality of an operator’s reserves or projects.
For example, reported metrics for Canadian Energy Exploration Inc. include 135.25 million shares outstanding and a float of 130.23 million shares. Its average trading volume was 287.54 thousand shares over 30 days, and its price-to-book ratio was 0.39. These figures describe that company’s market measures, not the Canadian upstream sector as a whole. Investors should keep each metric tied to its named issuer.
Escrow shares also affect how investors interpret a share structure. Canadian Energy Exploration Inc. had 4.38 million escrow shares. Escrow status can limit when particular shares may be traded, so investors should distinguish those shares from the freely traded float. A share count alone doesn’t show how much equity might later enter public trading; the terms and timing associated with escrow matter.
A disciplined comparison uses consistent periods and separates operating results from market measures. Review production and reserve disclosures alongside capital plans, financing needs and relevant risk information. Then examine share structure and trading indicators in the same issuer’s context. Canadian Energy Exploration Inc.’s beta was 4.71809, another market metric that should be interpreted with its calculation period and comparison basis. No single ratio provides a complete assessment.
For readers considering public equity investment in upstream energy, connect the company’s operating strategy with its listed shares and disclosed financial information. An exploration-focused company may have a different development profile from one producing established assets. Assess how the business allocates capital, manages infrastructure and describes its resource plans. This approach makes market data more useful without treating a share statistic as a substitute for operational analysis.
Western Canadian Sedimentary Basin operations
The Western Canadian Sedimentary Basin (WCSB) is a major operating region for Canada’s oil and gas industry. Its geology spans Alberta, northeastern British Columbia, Saskatchewan and parts of Manitoba. Alberta and Saskatchewan are central to onshore activity, while northeastern British Columbia is associated with natural gas development. Activity varies by formation, infrastructure access and project economics.
Operators begin with geological interpretation, using subsurface data to identify prospective formations and plan wells. In the WCSB, conventional reservoirs and resource plays call for different development designs. A conventional target may be developed through a well accessing a discrete reservoir. Tighter formations can require horizontal drilling and hydraulic fracturing. Geology, expected production profile and available infrastructure shape the approach.
Infrastructure can determine whether a resource is practical to develop. Gathering pipelines move oil and gas from wells to processing facilities, where products are prepared for transportation or sale. Processing capacity, pipeline access and distance to existing connections all influence project planning. A promising gas-bearing formation, for example, still needs a workable route from the well site to processing and market.
WCSB operations also connect to established supply chains. Natural gas may need processing before entering a pipeline, while oil moves through gathering and transportation systems. Condensate can be produced alongside natural gas and handled through suitable facilities. Because these systems are linked, development involves more than drilling: operators must coordinate well design, production equipment and infrastructure throughout a project.
Environmental and land considerations influence where and how operations proceed. A proposed well pad needs access, surface planning and connections to supporting infrastructure. Operators can assess whether existing roads or facilities can serve a project, avoiding separate developments where practical. Water handling, emissions management and reclamation planning also belong in the operating plan, from site preparation through production and closure.
Which provinces and territories have the most oil and gas exploration activity? Alberta and Saskatchewan are leading onshore areas, with significant activity also occurring in northeastern British Columbia. The Northwest Territories and other regions have petroleum resources, but activity varies with geology, infrastructure and project economics.
When assessing a WCSB project, connect four factors: target formation, well design, infrastructure access and environmental planning. A strong geological prospect must align with a feasible development plan and routes to market. This integrated view shows why basin operations depend on both subsurface knowledge and disciplined execution.
Explore conventional oil and gas exploration to see how basin development connects geological opportunity with operating strategy.
Decimus Oil Corp.: Public Equity Investment (TSXV:WCSB)
Decimus Oil Corp. is a Canadian energy exploration company focused on conventional oil and gas exploration, energy infrastructure and enhanced oil recovery. Its shares trade on the TSX Venture Exchange as WCSB. The company’s focus connects public equity investment with resource development and asset operations.
If you’re assessing an investment, consider how these activities relate to your interests in exploration, infrastructure and recovery strategies. Public equity provides exposure to a company through its listed shares, but you still need to review its disclosures and market information. Decimus Oil Corp. may interest readers exploring an energy company focused on resource development and public equity.
To learn more, visit Decimus Oil Corp. online.
Make your next energy decision with a clear operating perspective
For investors and industry observers, the next step is to connect operational strategy with long-term resource development. A Canadian energy exploration company must align geological opportunity, infrastructure and environmental management as conditions evolve. Assessing an operator’s approach is essential, whether you’re considering sector exposure or seeking to understand how upstream assets create value over time.
Decimus Oil Corp. offers public equity investment through TSXV:WCSB, alongside conventional oil and gas exploration and energy infrastructure. These activities provide a focused point of reference for readers interested in how exploration and supporting assets fit within Canada’s energy sector. Consider how your objectives align with an upstream company’s strategy, then take the next step by learning more directly. Contact Decimus Oil Corp. to discuss your needs and continue your evaluation with confidence.
Frequently Asked Questions
What Canadian companies explore for oil and natural gas?
Canadian oil and natural gas exploration companies include Decimus Oil Corp. and Canadian Energy Exploration Inc. ARC Resources is another industry example; it became a member of the Shell Group on September 2, 2026. These companies differ in ownership, assets and operating focus. To compare them, distinguish independent Canadian-listed businesses from companies that have joined a larger corporate group, then review each company’s current disclosures.
Which Canadian energy exploration companies are the largest by market capitalization?
There is no permanent ranking of the largest companies because market capitalization changes with share prices and the number of shares counted. Calculate it by multiplying a company’s share price by its applicable shares outstanding, using the same trading date for each comparison. Decimus Oil Corp. trades on the TSX Venture Exchange as WCSB, but its listing alone does not establish its relative market-cap rank. Compare current figures and share structures before drawing conclusions.
What are the leading Canadian energy exploration companies by production and reserves?
The top 10 Canadian exploration and production companies held combined reserves of 29,256 MMboe in 2021. Production and reserve rankings differ, so the leading companies depend on which measure is used.
What permits and regulations apply to energy exploration in Canada?
Permits and approvals depend on the province or territory, project location and proposed activity. Exploration may require approvals related to land access, drilling, water use and environmental review.
How do companies acquire mineral rights and exploration licenses in Canada?
Companies acquire mineral rights through the applicable provincial or territorial tenure process, then secure approvals for the proposed work.
Which Canadian energy exploration companies have recent projects, discoveries, or news?
ARC Resources became a member of the Shell Group on September 2, 2026, a corporate change that reshaped the sector.


