

Canadian energy company shareholder value depends on more than a rising share price: capital budgets, production guidance, cash flow and market expectations all shape the outlook. Analyst price-target data across the sector highlight that company scale alone doesn't guarantee potential returns, making careful evaluation essential for investors.
For Canadian investors, comparing energy companies like Decimus Oil Corp. means looking beyond the numbers to the plans behind them. A large budget may support future production, but its effect on shareholder value depends on execution, costs and cash generated by operations.
This article explains how budgets, production guidance and analyst targets shape shareholder value, and compares measures investors can use to assess Canadian energy companies. You'll also see how earnings, free cash flow, debt and valuation add context to a company's outlook.
Key Takeaways
- Read analyst price targets as market expectations, then compare them with the company’s operating outlook and your own investment horizon.
- Assess five- and ten-year shareholder returns alongside capital allocation decisions, including how buybacks can affect ownership and earnings per share.
- Compare earnings, free cash flow, debt and valuation together to understand how effectively a company funds investment and supports shareholder returns.
- Factor carbon costs, emissions requirements and energy policy into your view of operating expenses, project decisions and long-term valuation.
2. Analyst price-target upside and downside
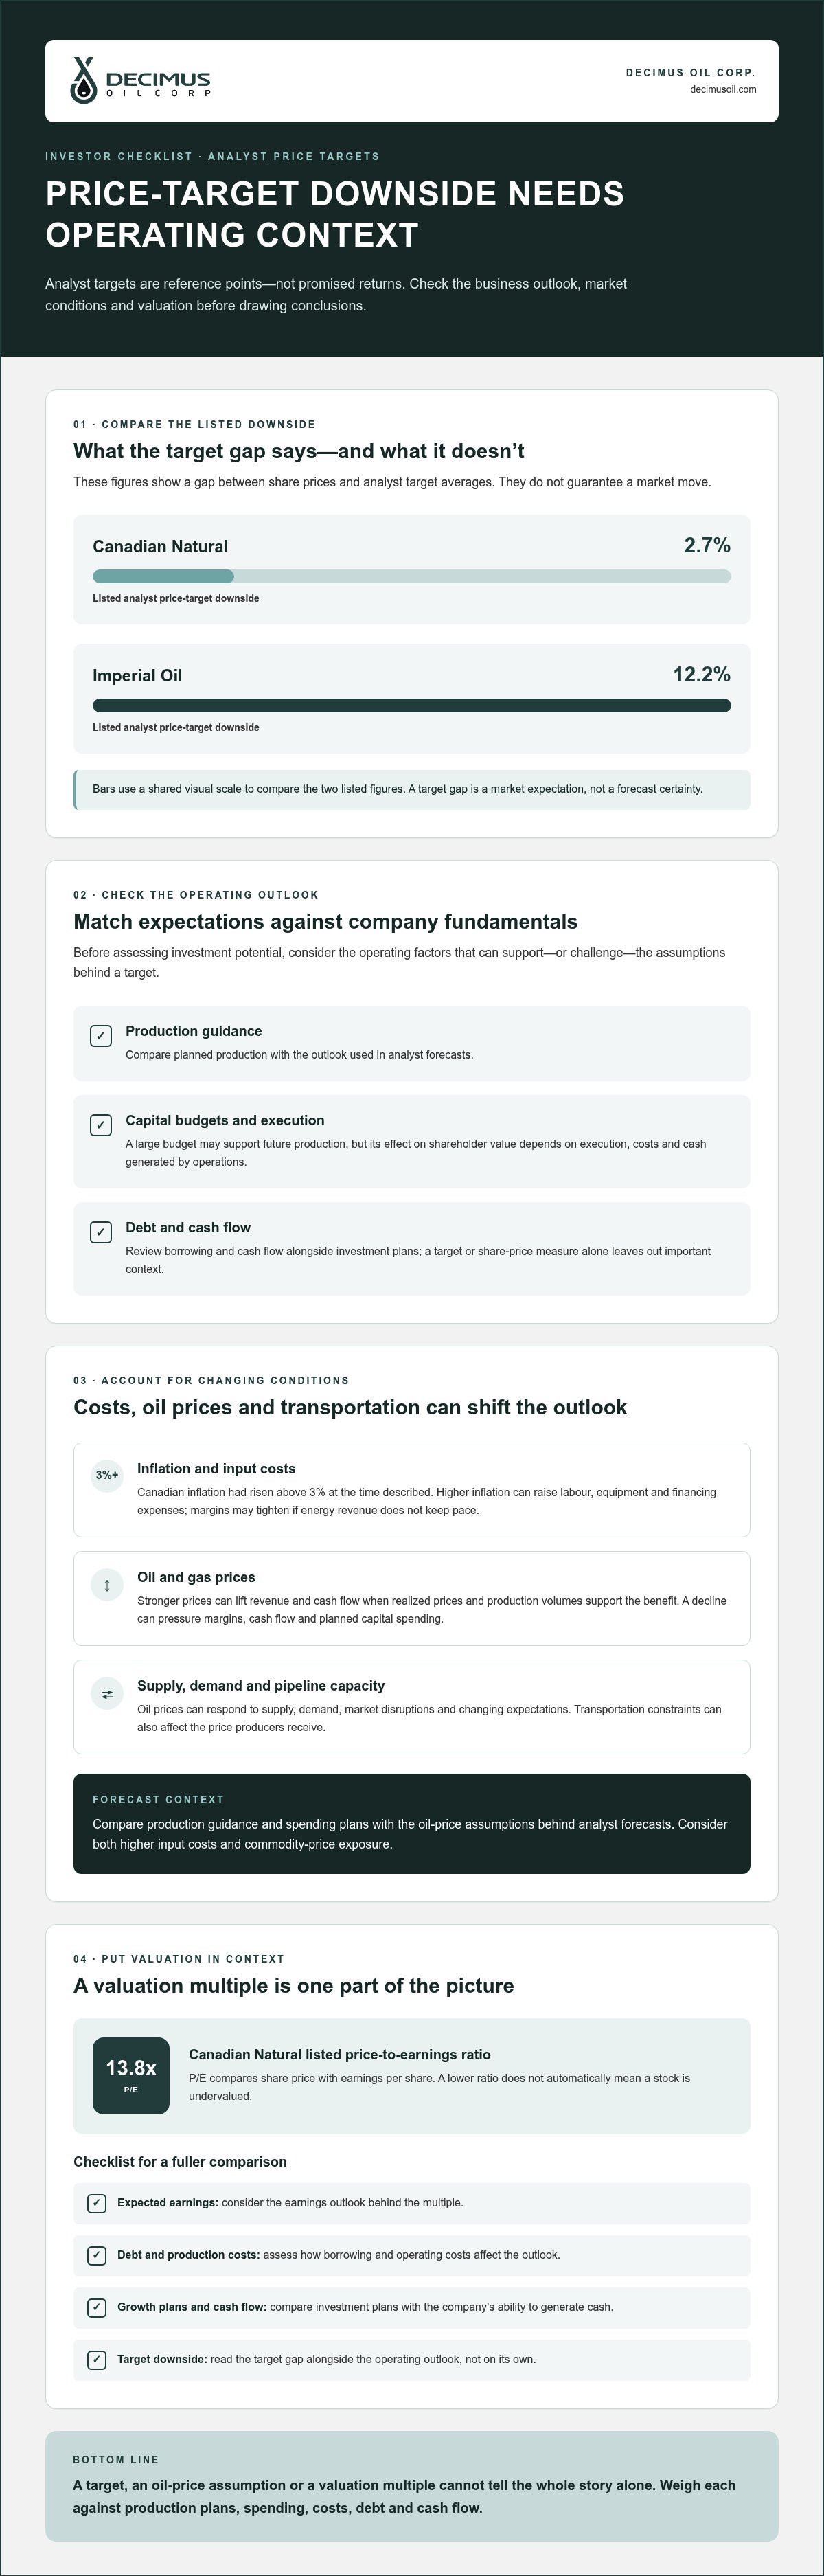
Analyst price targets translate forecasts into a reference point, not a promised return. Canadian Natural has listed analyst price-target downside of 2.7%. Imperial Oil’s listed downside is 12.2%. These figures indicate a gap between share prices and analyst target averages, not a guaranteed market move. Compare each target with production guidance, capital budgets, debt and cash flow before assessing investment potential.
Canadian inflation had risen above 3% at the time described, affecting costs and investor expectations. Higher inflation can raise labour, equipment and financing expenses. Margins may tighten if energy revenue doesn’t keep pace. Conversely, stronger oil and gas prices can lift revenue and cash flow when realized prices and production volumes support the benefit. Assess whether the company’s outlook accounts for both higher input costs and commodity-price exposure.
Oil prices shift with supply, demand, market disruptions and changing expectations. A higher benchmark may boost producer revenue, while a decline can pressure margins, cash flow and planned capital spending. Pipeline capacity matters too: transportation constraints can affect the price producers receive. To assess an outlook, compare production guidance and spending plans with the oil-price assumptions behind analyst forecasts. This context helps explain why targets may differ.
Valuation adds another comparison point. Canadian Natural’s listed price-to-earnings ratio is 13.8x, a measure comparing its share price with earnings per share. A lower ratio doesn’t automatically mean a stock is undervalued; expected earnings, debt, production costs and growth plans influence how investors interpret it. Compare the ratio with the company’s cash flow outlook and price-target downside. This gives portfolio decisions a fuller basis than a target or valuation multiple alone, especially when energy stocks face changing inflation and oil-price conditions.
3. How has shareholder value changed for major Canadian energy companies over the past 5 and 10 years?
A five-year and ten-year review can tell different stories about the same Canadian energy stock. Compare share-price performance with total shareholder return, which includes reinvested dividends. Share price alone excludes cash distributions, while total return shows how both price changes and dividends affected an investment over the period. Use the same start and end dates when comparing companies such as Canadian Natural, Suncor Energy and Imperial Oil.
Separate company performance from broader shifts in the energy market. A producer’s revenue and cash flow respond to commodity prices, production volumes, operating costs and capital spending. Over time, these factors can move in different directions, so compare annual reports across the full five-year and ten-year periods. Track production guidance, debt, dividends and project investment to see what supported returns and what put pressure on them.
Capital allocation is another important part of a company’s record. Canadian energy producers have allocated billions of dollars to share buyback programmes in recent years. Repurchases reduce shares outstanding, which can raise earnings per share and increase existing shareholders’ ownership percentages. Assess the effect by comparing buybacks with dividend payments, capital budgets and balance sheets. A repurchase is one component of shareholder returns, not a substitute for reviewing operating performance.
For a practical comparison, build a simple five-year and ten-year table for each stock. Record total return, dividend changes, share-count changes, production trends and debt direction, using consistent reporting periods. Note major strategic shifts that affected capital allocation or the asset base. This framework helps explain why producers exposed to similar commodity markets may deliver different outcomes. It also makes historical results more useful when assessing whether current plans align with a company’s longer-term approach to shareholder value.
4. How do Canadian energy companies compare on earnings, cash flow, debt, and valuation?
Start with scale, but don’t treat market capitalization as a complete valuation. Enbridge’s listed market capitalization is C$150.16 billion, while Suncor Energy’s is C$130.04 billion. Market capitalization reflects share price multiplied by shares outstanding; it doesn’t show debt, operating performance or how much cash remains after investment. Compare each figure with earnings and cash flow to understand what investors are valuing.
Earnings show whether a company made a profit during a reporting period. For producers such as Suncor Energy, compare earnings with production, realized commodity prices and operating expenses. Review earnings per share alongside the share count, since repurchases can affect that measure. Accounting earnings may include non-cash items, so they don’t show the full funds available for projects, debt reduction or distributions.
Free cash flow is the cash remaining after a company funds operating expenses and capital investments. Compare it across reporting periods, then consider whether available cash goes to dividends, share repurchases, debt repayment or development. Capital-intensive businesses may report strong earnings while directing substantial cash to ongoing investment. A consistent comparison should distinguish cash generated by operations from spending needed to maintain or develop assets.
Debt adds another layer to valuation. Compare total debt with cash flow and earnings, and review repayment obligations alongside planned capital spending. A debt-to-earnings measure can show how operating performance relates to borrowing, but commodity-price changes may affect both earnings and the ratio. For a structured assessment, compare the same reporting periods and use consistent measures across companies. Evaluate price-to-earnings ratios, cash flow and debt together, rather than treating Enbridge’s or Suncor Energy’s market capitalization as a stand-alone measure of value.
4. How do carbon taxes, emissions rules, and energy policies affect Canadian energy company valuations?
Carbon pricing can affect a Canadian producer’s operating costs and projected margins. The financial impact depends on emissions intensity, fuel use, production methods and the company’s ability to improve efficiency. Compare these factors across producers, then consider how added costs could affect forecast earnings and cash flow. Because valuation reflects expected future cash generation, sustained cost pressure may weigh on forecasts.
Emissions rules can also affect capital budgets. Monitoring, measurement and emissions-reduction projects may require spending that competes with drilling, maintenance or shareholder distributions. Compare a producer’s stated environmental investments with production guidance and planned capital spending. Assess whether those projects may support operating efficiency over time, rather than viewing their costs in isolation. The balance between near-term outlays and longer-term operating effects matters to valuation.
Energy policy shapes the conditions for producing and moving resources. Permitting decisions, infrastructure approvals and market-access policy can affect project timelines and the ability to transport output. A pipeline constraint, for example, may limit a producer’s access to buyers or competitive prices. Investors can examine how a company’s assets, transport arrangements and development plans interact with policy conditions in the provinces where it operates.
To compare companies, connect policy exposure to financial measures. Review emissions-related spending, operating costs, production plans and expected cash flow together, then assess the assumptions behind projected returns. Distinguish an announced policy direction from a cost already reflected in company results. Consider whether infrastructure access supports project economics. This approach helps investors evaluate how Canadian energy policy could affect future earnings and valuations, without assuming every producer faces the same exposure.
Decimus Oil Corp.: Public Equity Investment (TSXV:WCSB)
Decimus Oil Corp. offers public equity investment through its TSXV:WCSB listing, giving investors a way to consider a Canadian energy company in their portfolios. Its work in conventional oil and gas exploration, resource development, energy infrastructure and enhanced oil recovery provides context for assessing how operational activity and asset development may relate to shareholder value. Consider these areas alongside company disclosures, financial performance, capital allocation and your investment objectives. For readers comparing Canadian energy companies, learning about Decimus Oil Corp.’s public equity opportunity and energy-sector focus is a natural next step. Shares must be purchased through a brokerage service provider. For more information, visit decimusoil.com.
Turn your research into a considered next step
A sound investment process goes beyond comparing companies. It connects your priorities with the business model, approach to asset development and public-market opportunity you’re prepared to assess. That perspective makes Canadian energy company shareholder value more practical in your decision-making, rather than reducing it to a single figure or forecast.
Decimus Oil Corp.’s public equity opportunity, listed as TSXV:WCSB, complements its focus on conventional oil and gas exploration and energy infrastructure. These areas give investors a basis for examining how resource development and infrastructure relate to portfolio objectives. Consider how that focus aligns with your investment thesis, risk tolerance and preferred exposure to Canada’s energy sector. Shares must be purchased through a brokerage service provider.
For a direct discussion of the company’s public equity opportunity, contact Decimus Oil Corp. to discuss your options. A clear investment framework can help you move forward with greater purpose.
Frequently Asked Questions
What are the latest share prices, market caps, and total shareholder returns of leading Canadian energy companies?
Share prices and total returns depend on the measurement date, while the available market-cap comparisons put Enbridge at C$150.16 billion and Suncor Energy at C$130.04 billion. To compare returns, select the same start and end dates for each stock and include reinvested dividends. This gives a more consistent basis for assessing Canadian energy company shareholder value across different companies and market conditions.
What factors are driving shareholder returns in Canada's oil, gas, electricity, and renewable energy sectors?
Returns reflect each sector’s revenue model and operating conditions. Oil and gas producers face exposure to commodity prices, production and operating costs. Electricity companies depend on power demand, generation mix and infrastructure performance, while renewable projects are affected by output, financing needs and access to buyers. When comparing companies for a portfolio, identify each one’s main revenue driver, then assess how operating costs and investment needs affect cash available to shareholders.
How do Canadian energy companies allocate capital among dividends, buybacks, debt reduction, and growth projects?
Companies balance shareholder distributions with financial resilience and investment opportunities. A company may prioritize debt reduction when borrowing limits flexibility, or fund a growth project when expected returns support the commitment. Dividends provide recurring distributions, while buybacks reduce shares outstanding. Compare these choices with operating cash generation and planned spending to understand how capital allocation shapes Canadian energy company shareholder value as market conditions change.
What are the main risks to shareholder value for Canadian energy companies, including commodity prices and regulation?
Key risks include weaker commodity prices, higher operating or financing costs, project delays, infrastructure constraints and changes in policy or emissions requirements. These factors can affect revenue, spending plans and cash-flow timing. Assess exposure by considering a lower-price scenario, reviewing debt obligations and identifying projects that depend on approvals or transportation access. Concentrated assets can also make Canadian energy company shareholder value more sensitive to local disruptions.


